Menu bar
Content's accurate location depictions are currently unavailable in the latest RepliMap version.
File
A horizontal bar located at the top left of the menu bar offers a variety of functions, including importing, exporting, and editing a map, as well as exiting the RepliMap software.
New
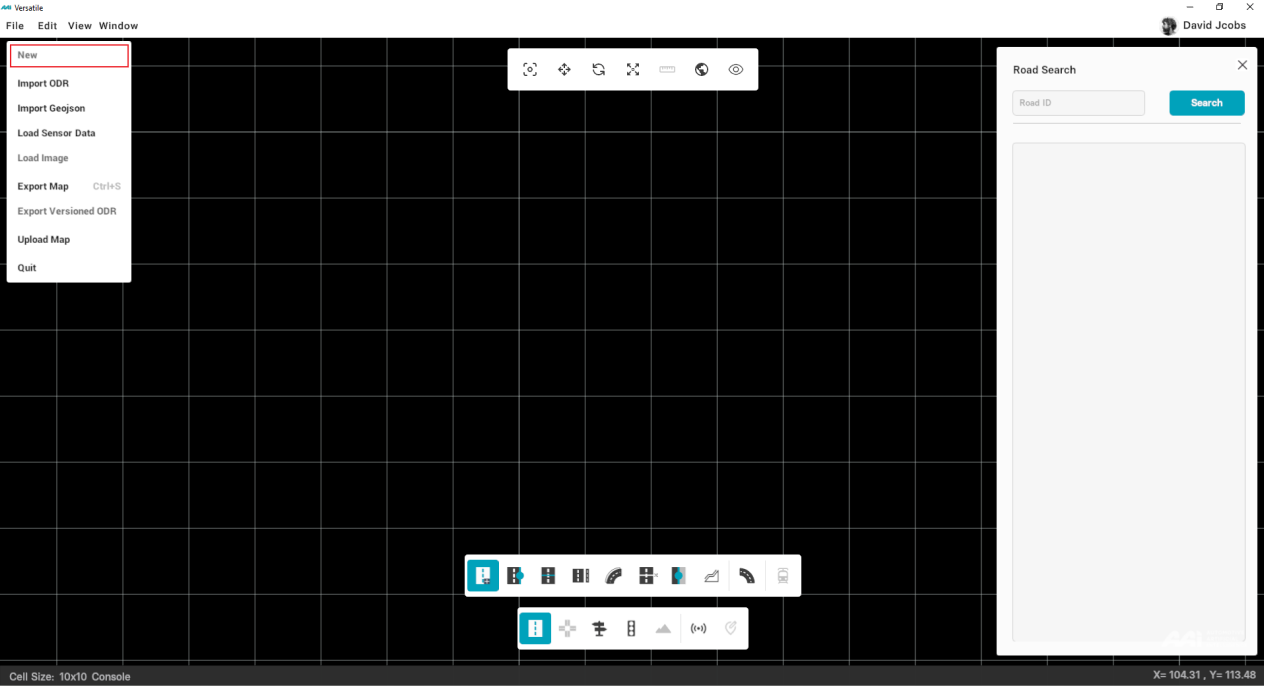
Below is a basic guideline to create your custom map in RepliMap by accessing several tools directly from the Editor bar. You can start creating your maps using the Menu bar tools. However, if you want to create a new, clean file, follow the steps below:
1. Move the cursor to the "File" option inside of the menu bar. Select "New" from drop-down menu.
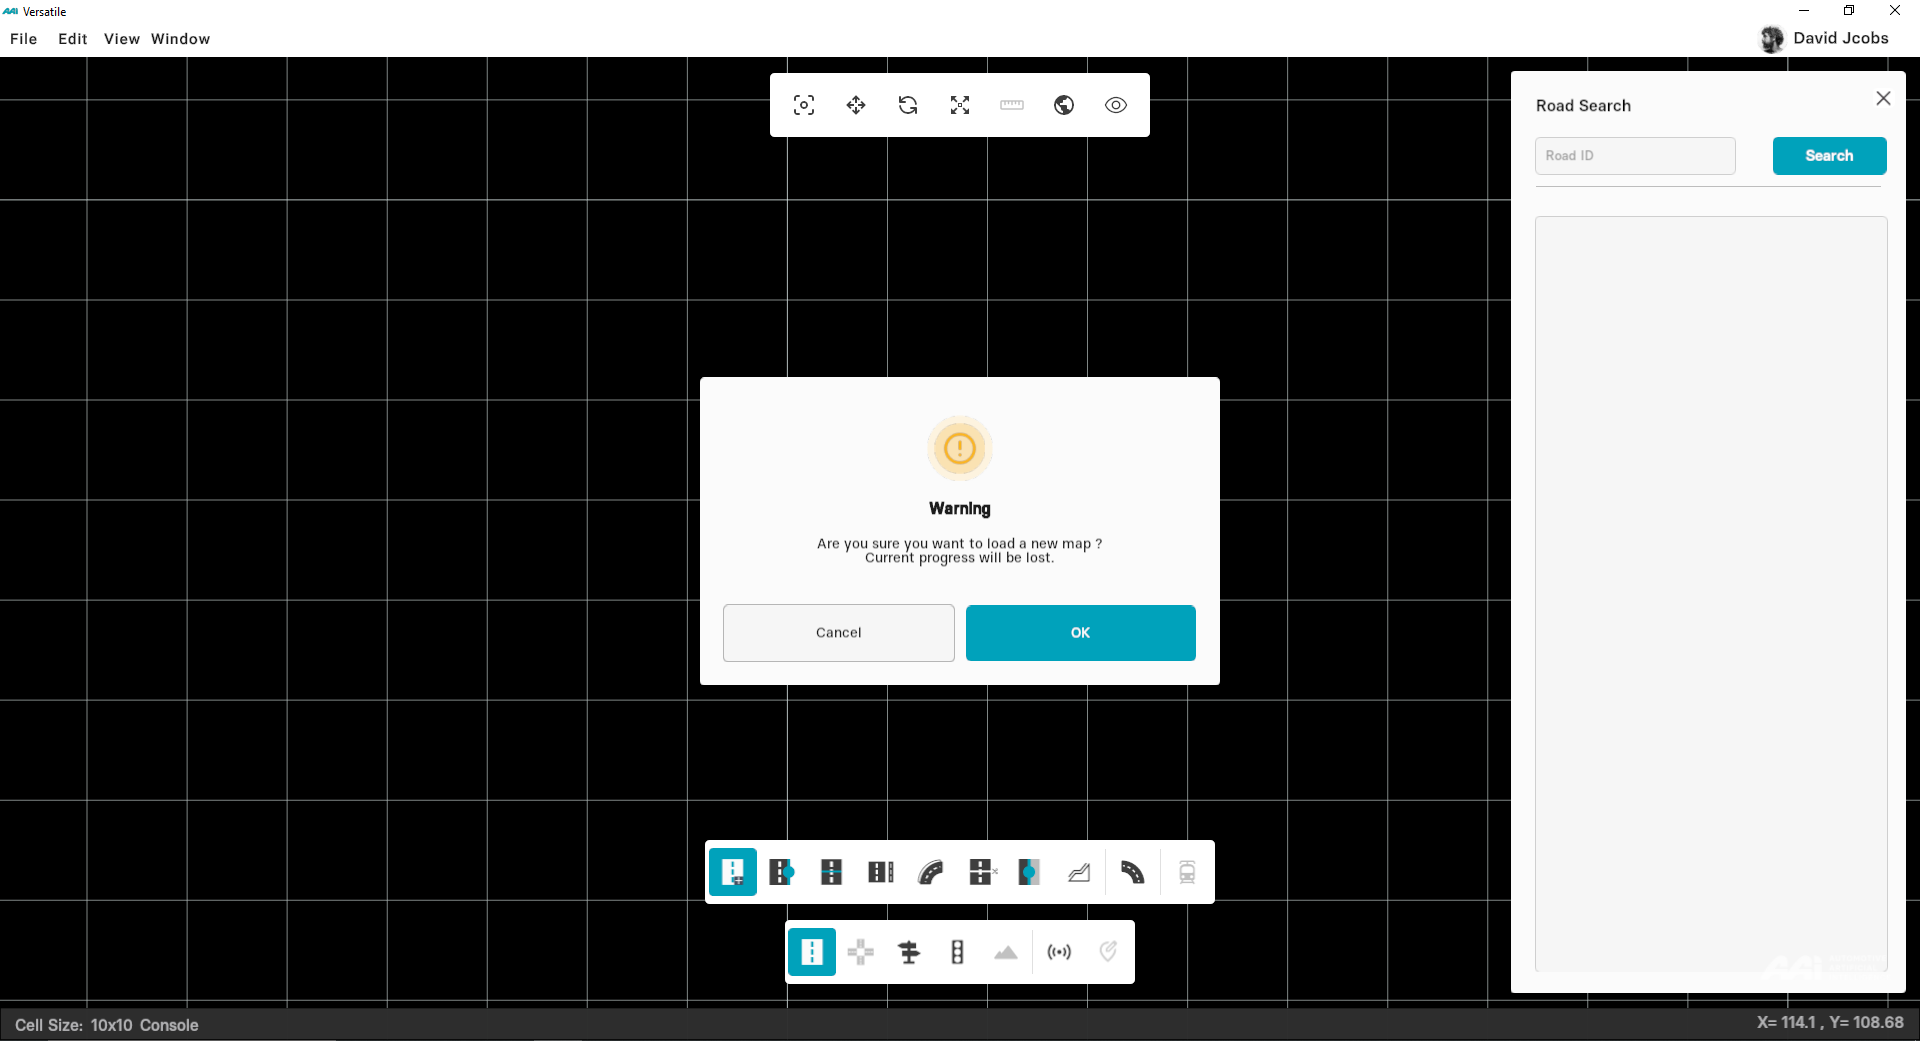
2. A prompt window appears displaying a warning as shown in figure below. Click "OK" to continue.
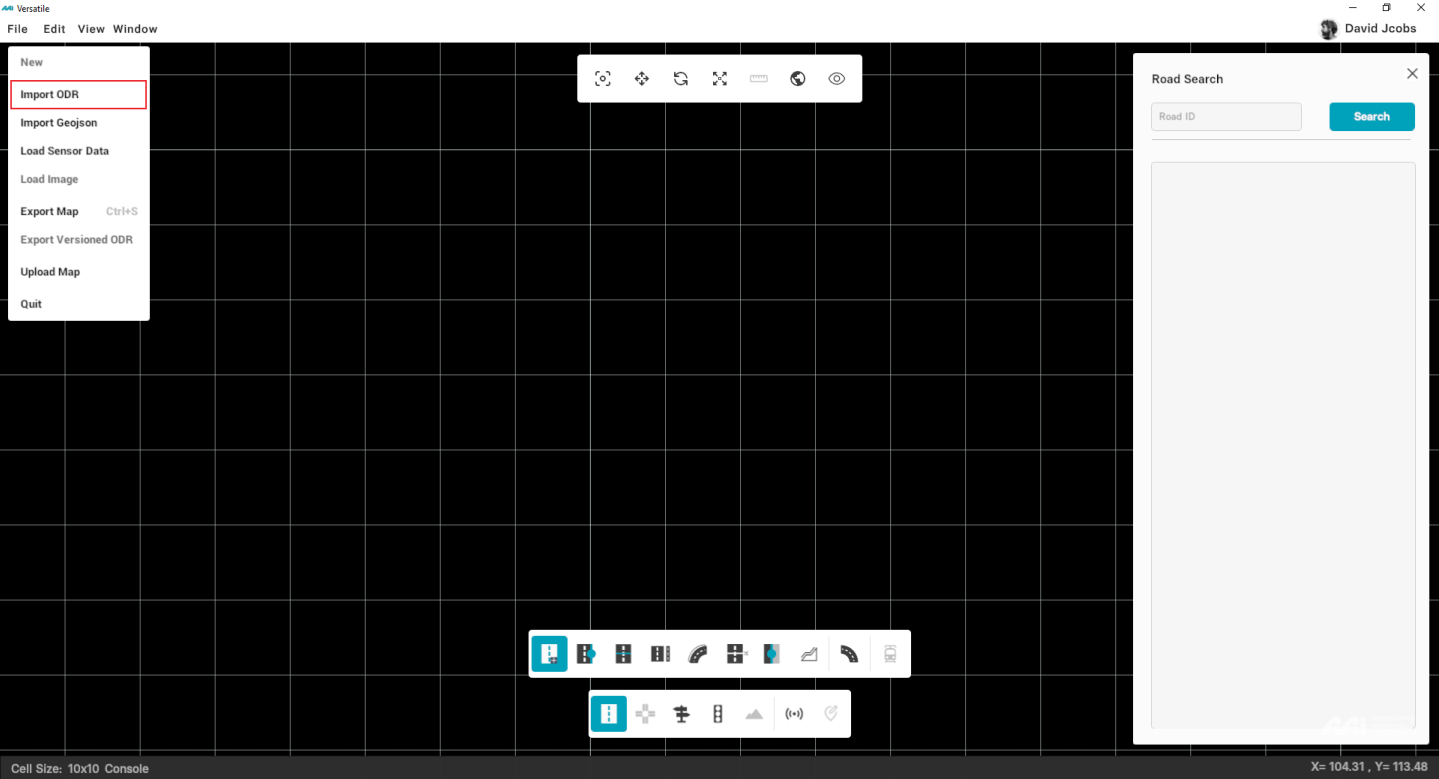
Import ODR
RepliMap allows you to import your previously saved maps. Note that the filename of your map should have the .xodr extension.
1. Move the cursor to the "File" option inside of the menu bar. Select "Import ODR" from drop-down menu.
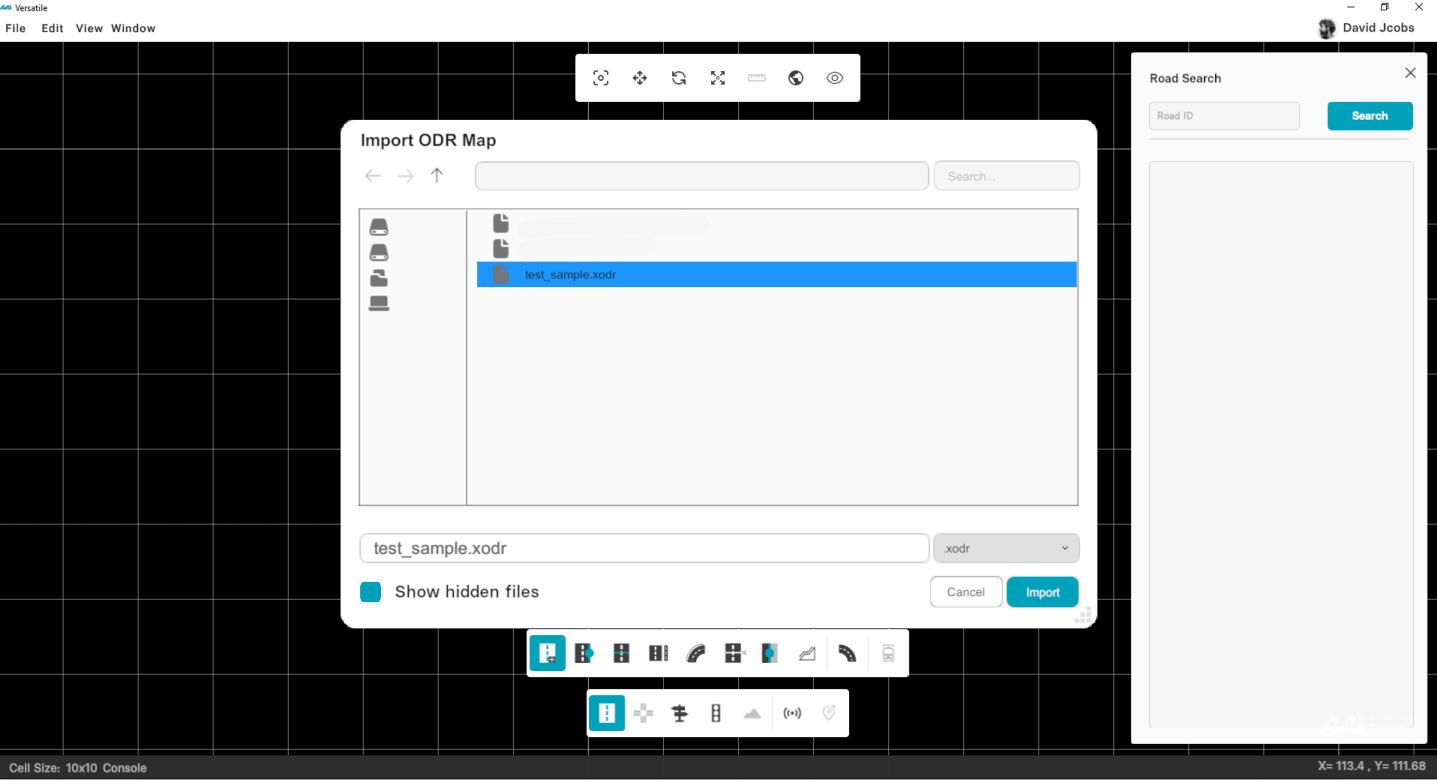
2. The browser will now open a predefined directory. You can select file destination from dialog box, enter a file name or simply select the desired file from the menu by clicking on it once.
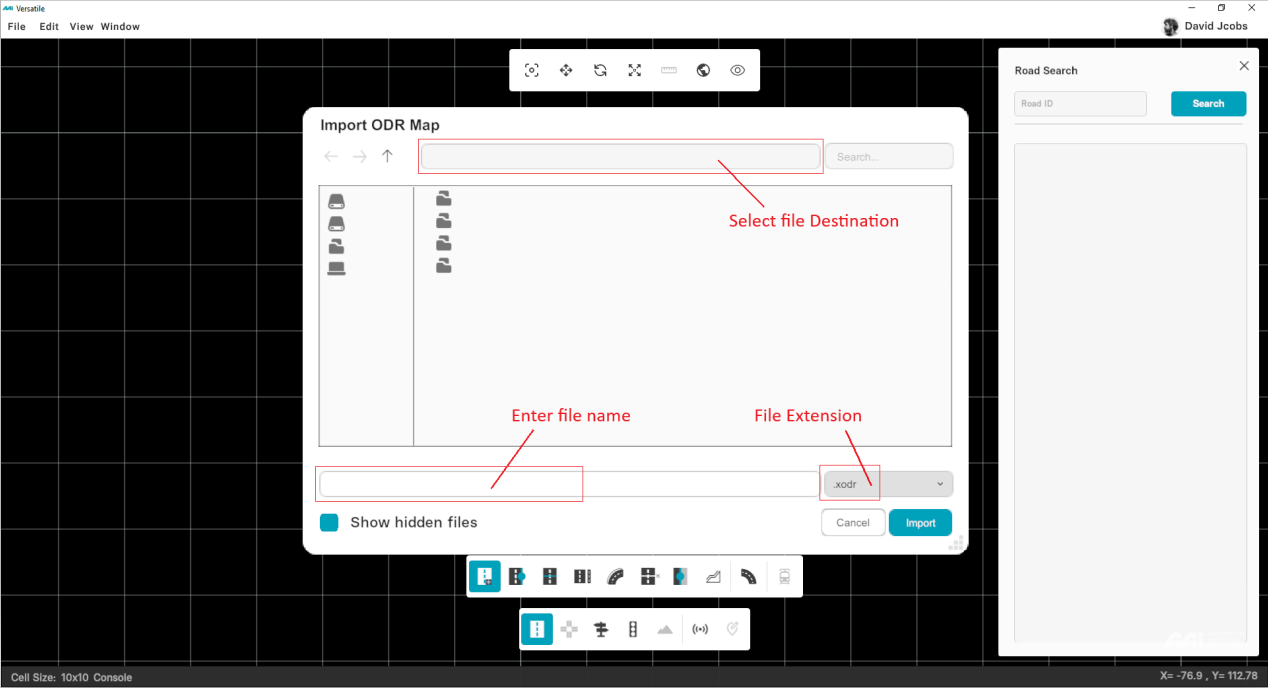
3. Press "Enter" from your keyboard or click on "Import" button to load your map in the Map-Editor.
Load Image
Enables users to insert a desired image of their choice into the RepliMap, offering versatility. Users can select the image, resize it, and position it anywhere on the map as needed.
Load Sensor Data
This function/option enables users to import sensor data into the mapping tool. Users can further adjust the data, including positioning and angles. The data comes directly from the measurement drives and is mainly point cloud data. However, the specifics of these adjustments will be covered later through the documentation accordingly. Once clicked, File Window will be opened with Folders file type.
Import GeoJSON
Used to bring external geometry or data layers into RepliMap for further editing, visualization, or scenario creation.
Coordinate Reference System (CRS)
When importing a GeoJSON file, users must specify the Coordinate Reference System (CRS) to ensure coordinates are correctly interpreted and converted.
Selecting the proper CRS guarantees that all features appear at the correct position and scale in the RepliMap environment.
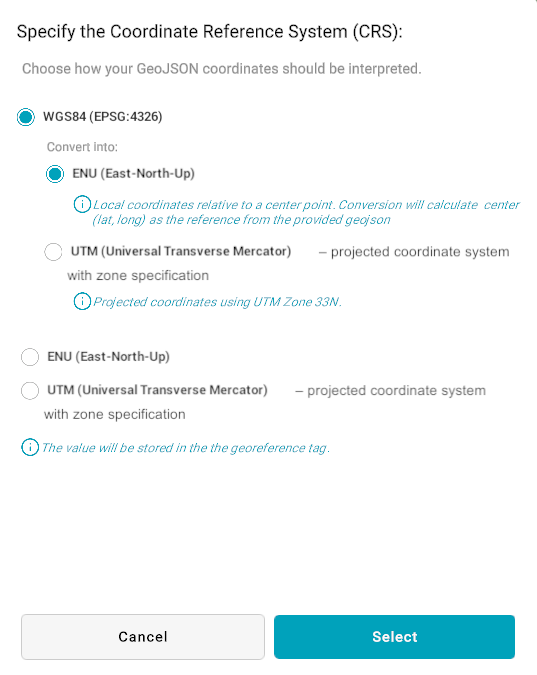
Example: CRS selection panel displayed during GeoJSON import.
Supported CRS Options
- WGS84 (EPSG:4326) — A geographic coordinate system using latitude and longitude values (in degrees). Recommended for global or GPS-based datasets.
- ENU (East-North-Up) — A local tangent plane coordinate system using metric units (meters).
- UTM (Universal Transverse Mercator) — A projected coordinate system using meters, divided into multiple geographic zones.
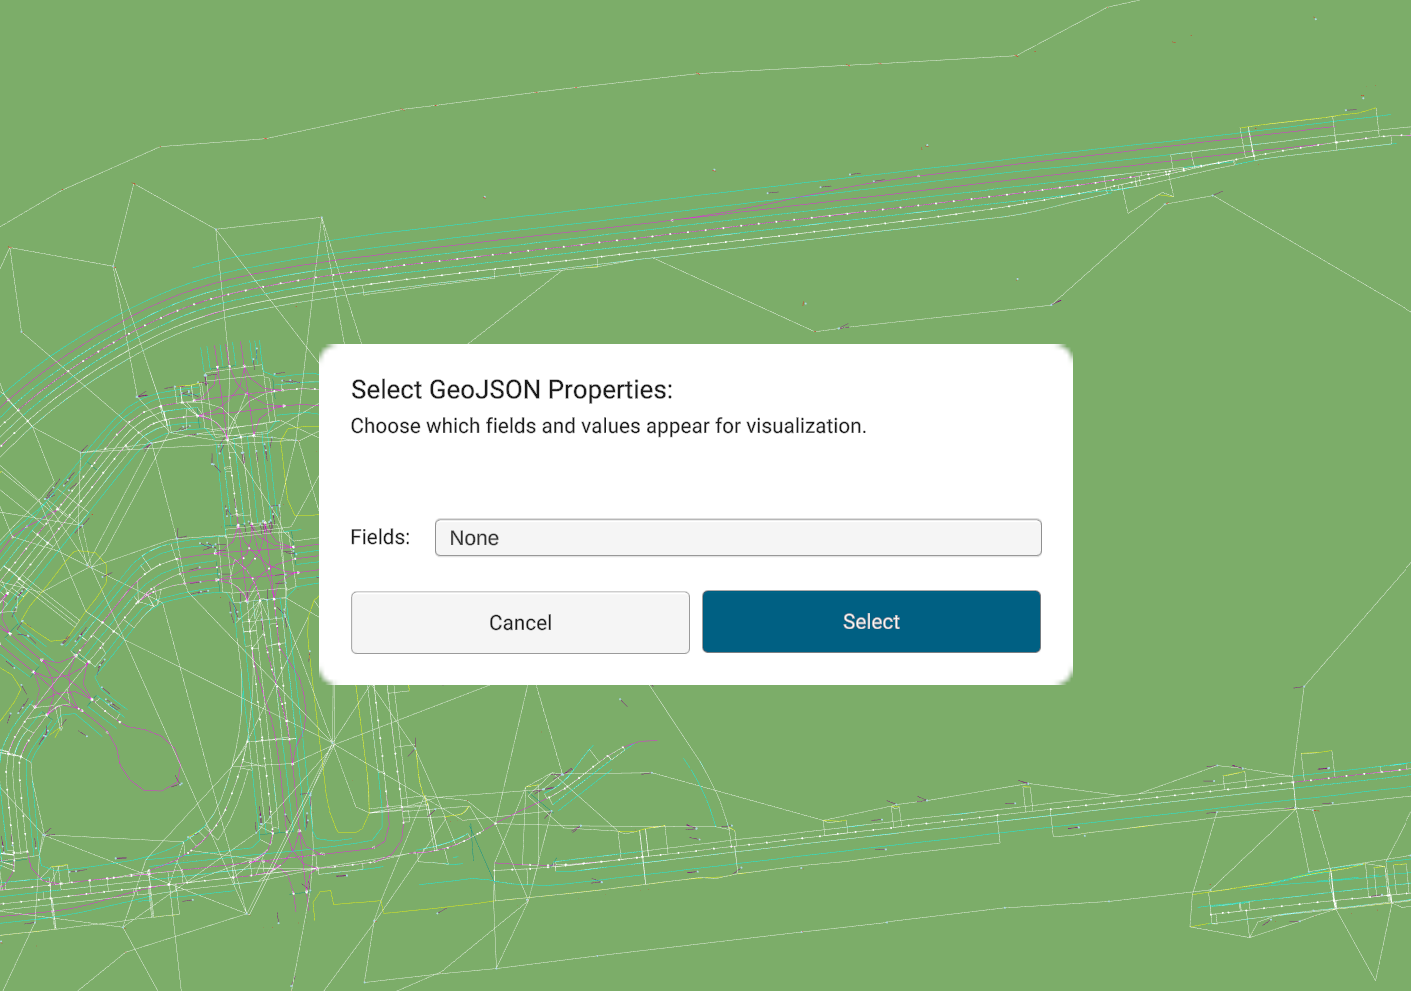
Selecting GeoJSON Properties
After pressing the Select button, a dialog box titled “Select GeoJSON Properties” appears, listing all detected fields from the imported GeoJSON file.
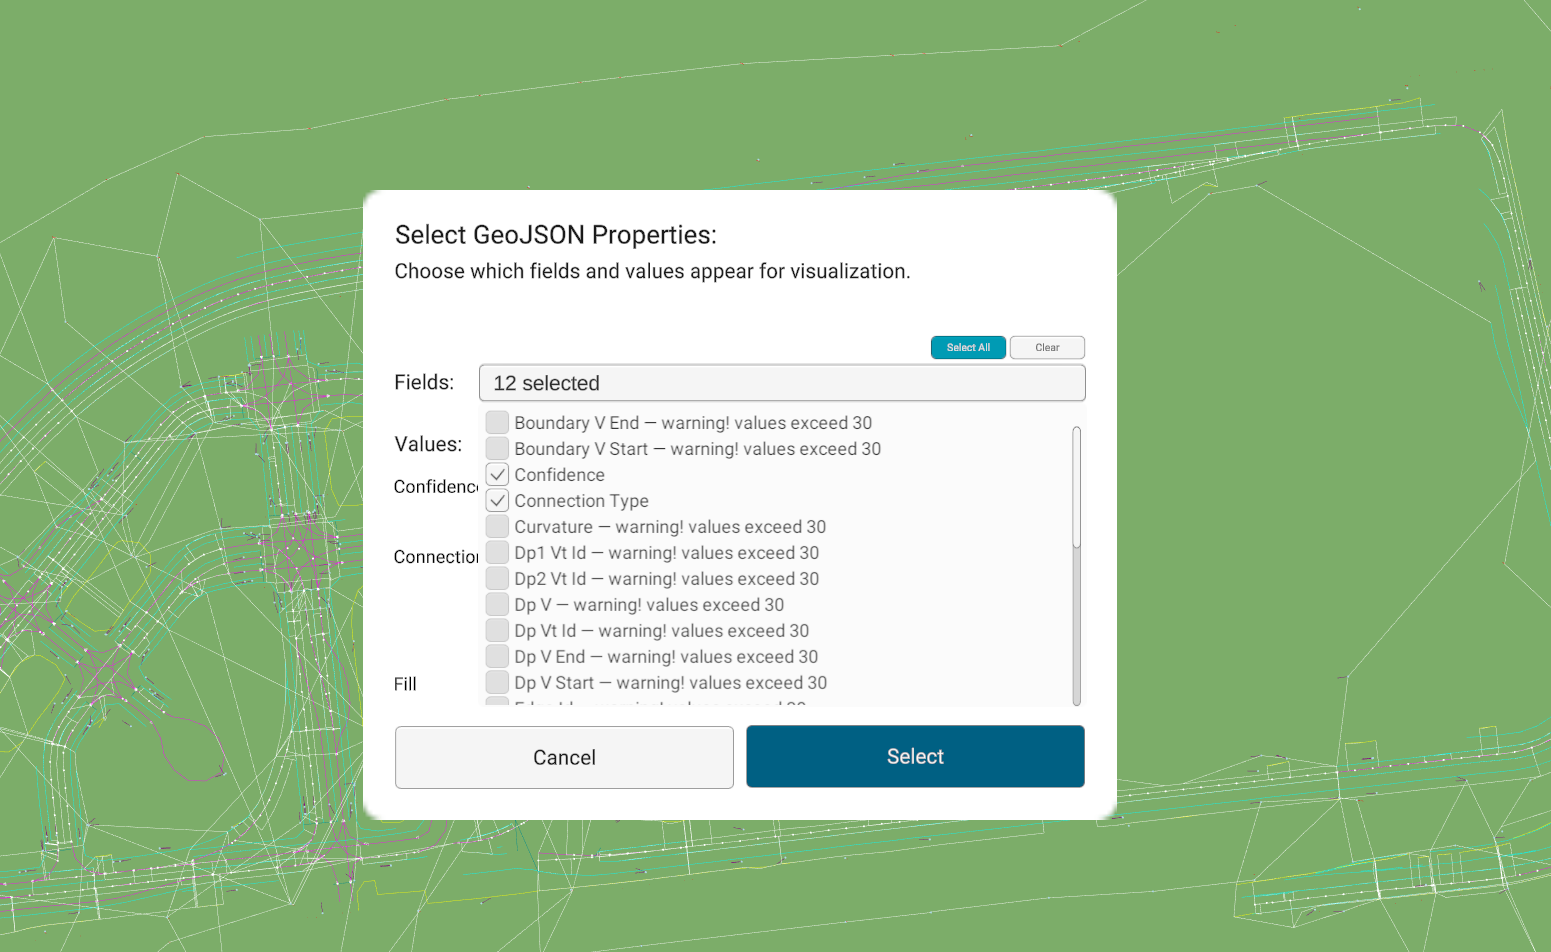
Field Selection Rules
Within the Select GeoJSON Properties dialog, users can manage which fields will be visible and available for further customization.
Rules:
- Only fields with values less than 30 are selectable.
- Fields containing values greater than 30 are automatically disabled (non-selectable).
- Users can:
- Select All – Select all available (value < 30) fields at once.
- Clear – Deselect all currently selected fields.
Before proceeding, users can review the list of selected fields and their data types within the dialog box for confirmation.
Confirming Selection
After verifying the field list, click on the Select button.
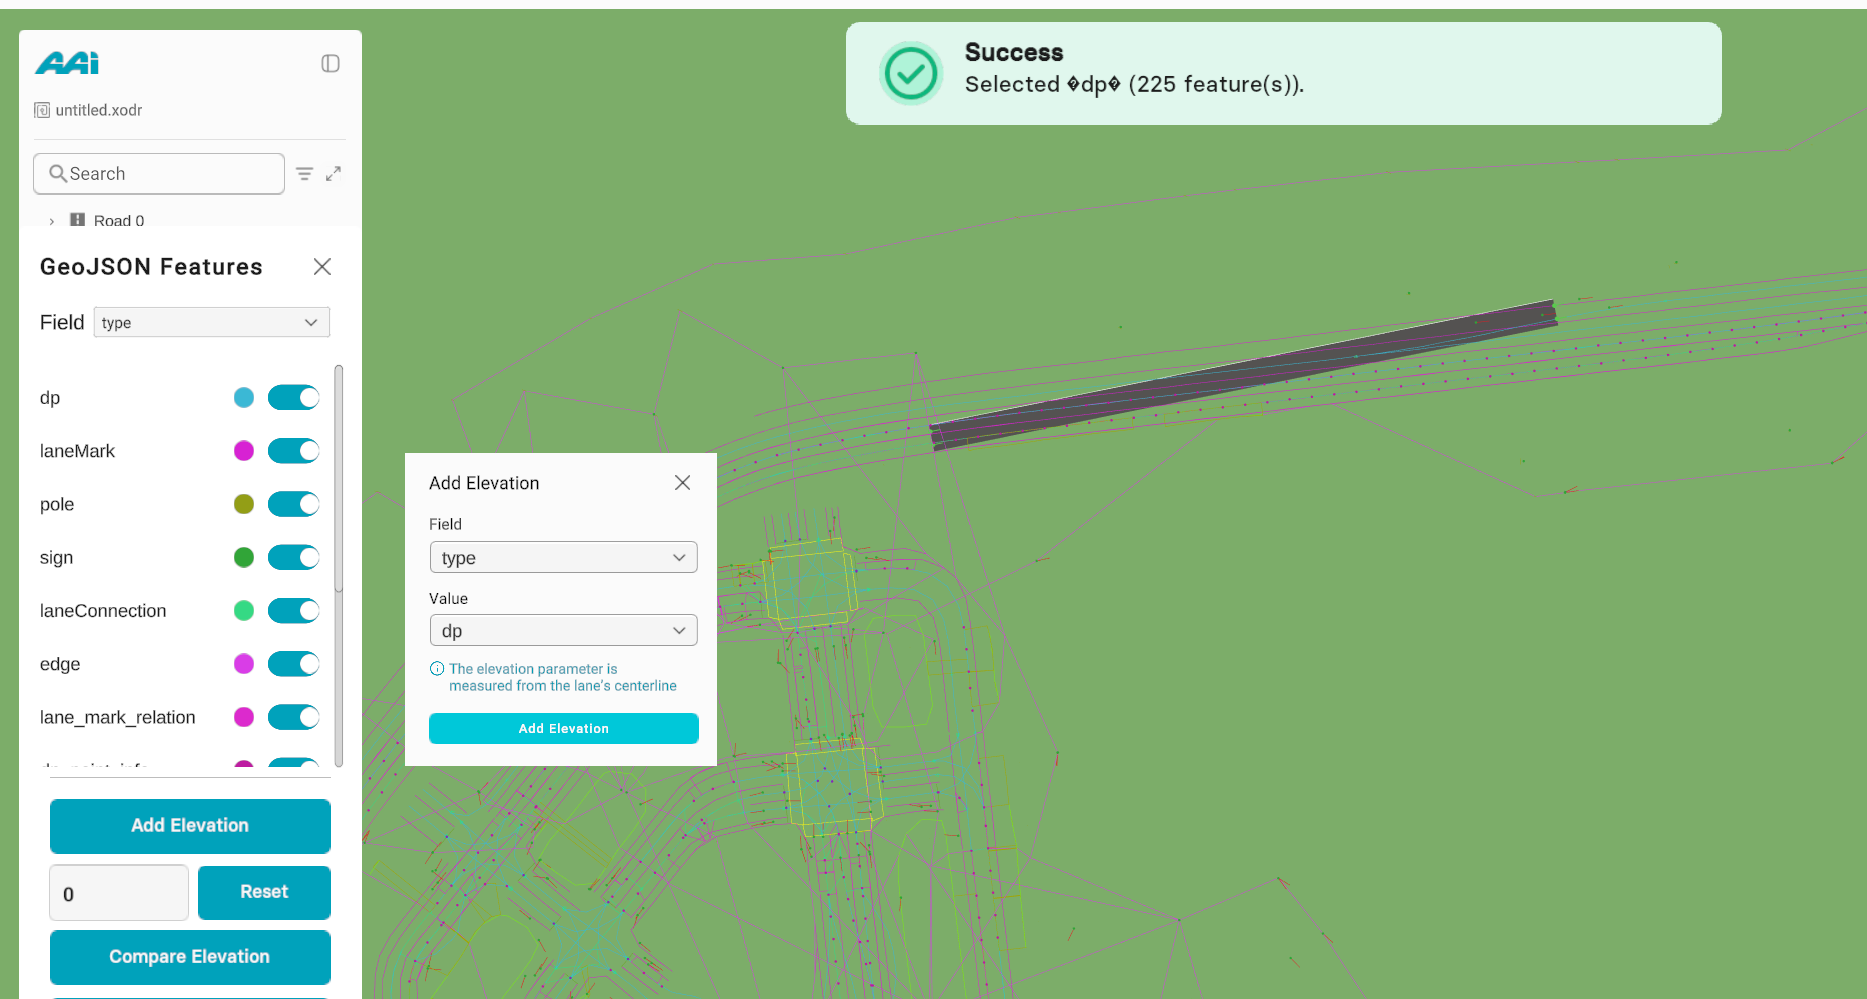
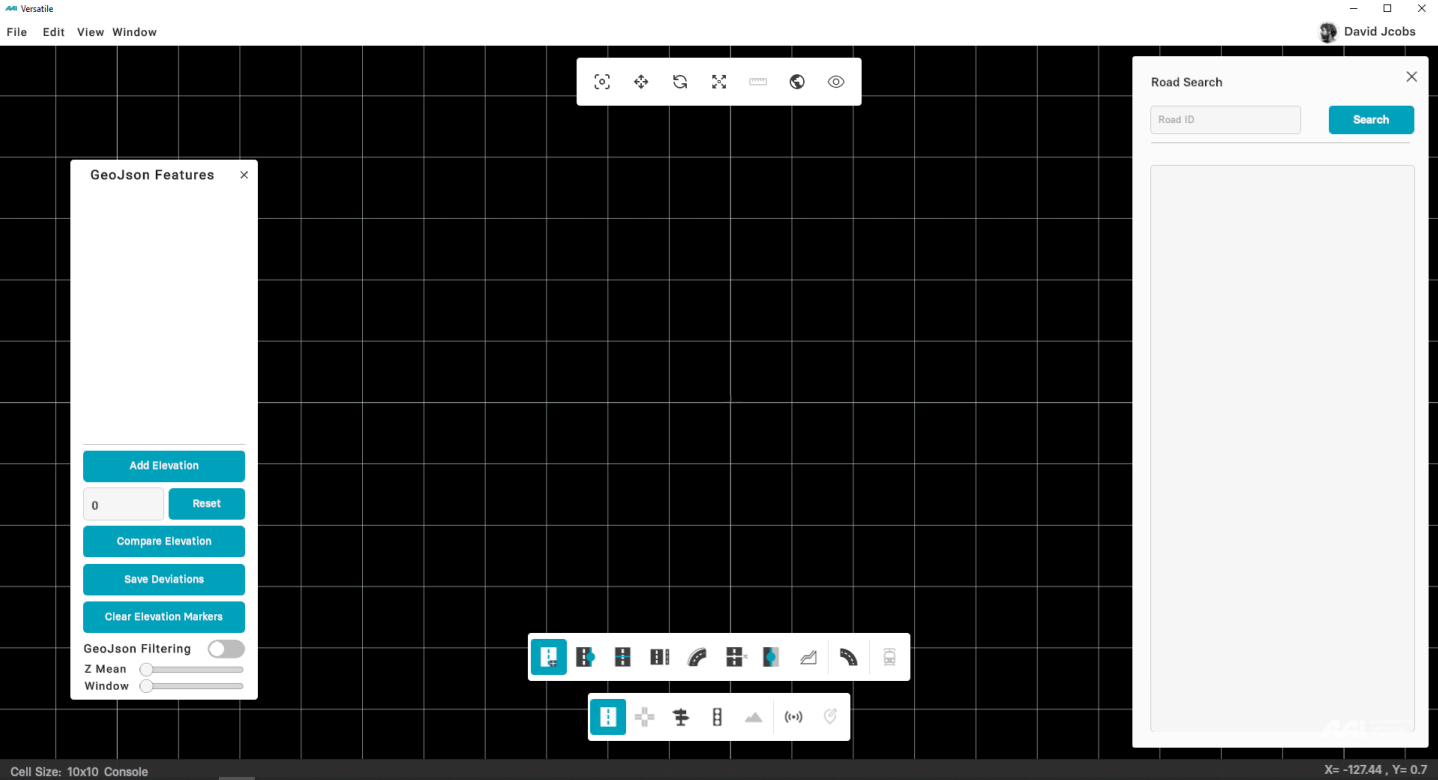
Once confirmed, the GeoJSON Features panel appears on the right side of the RepliMap editor interface.
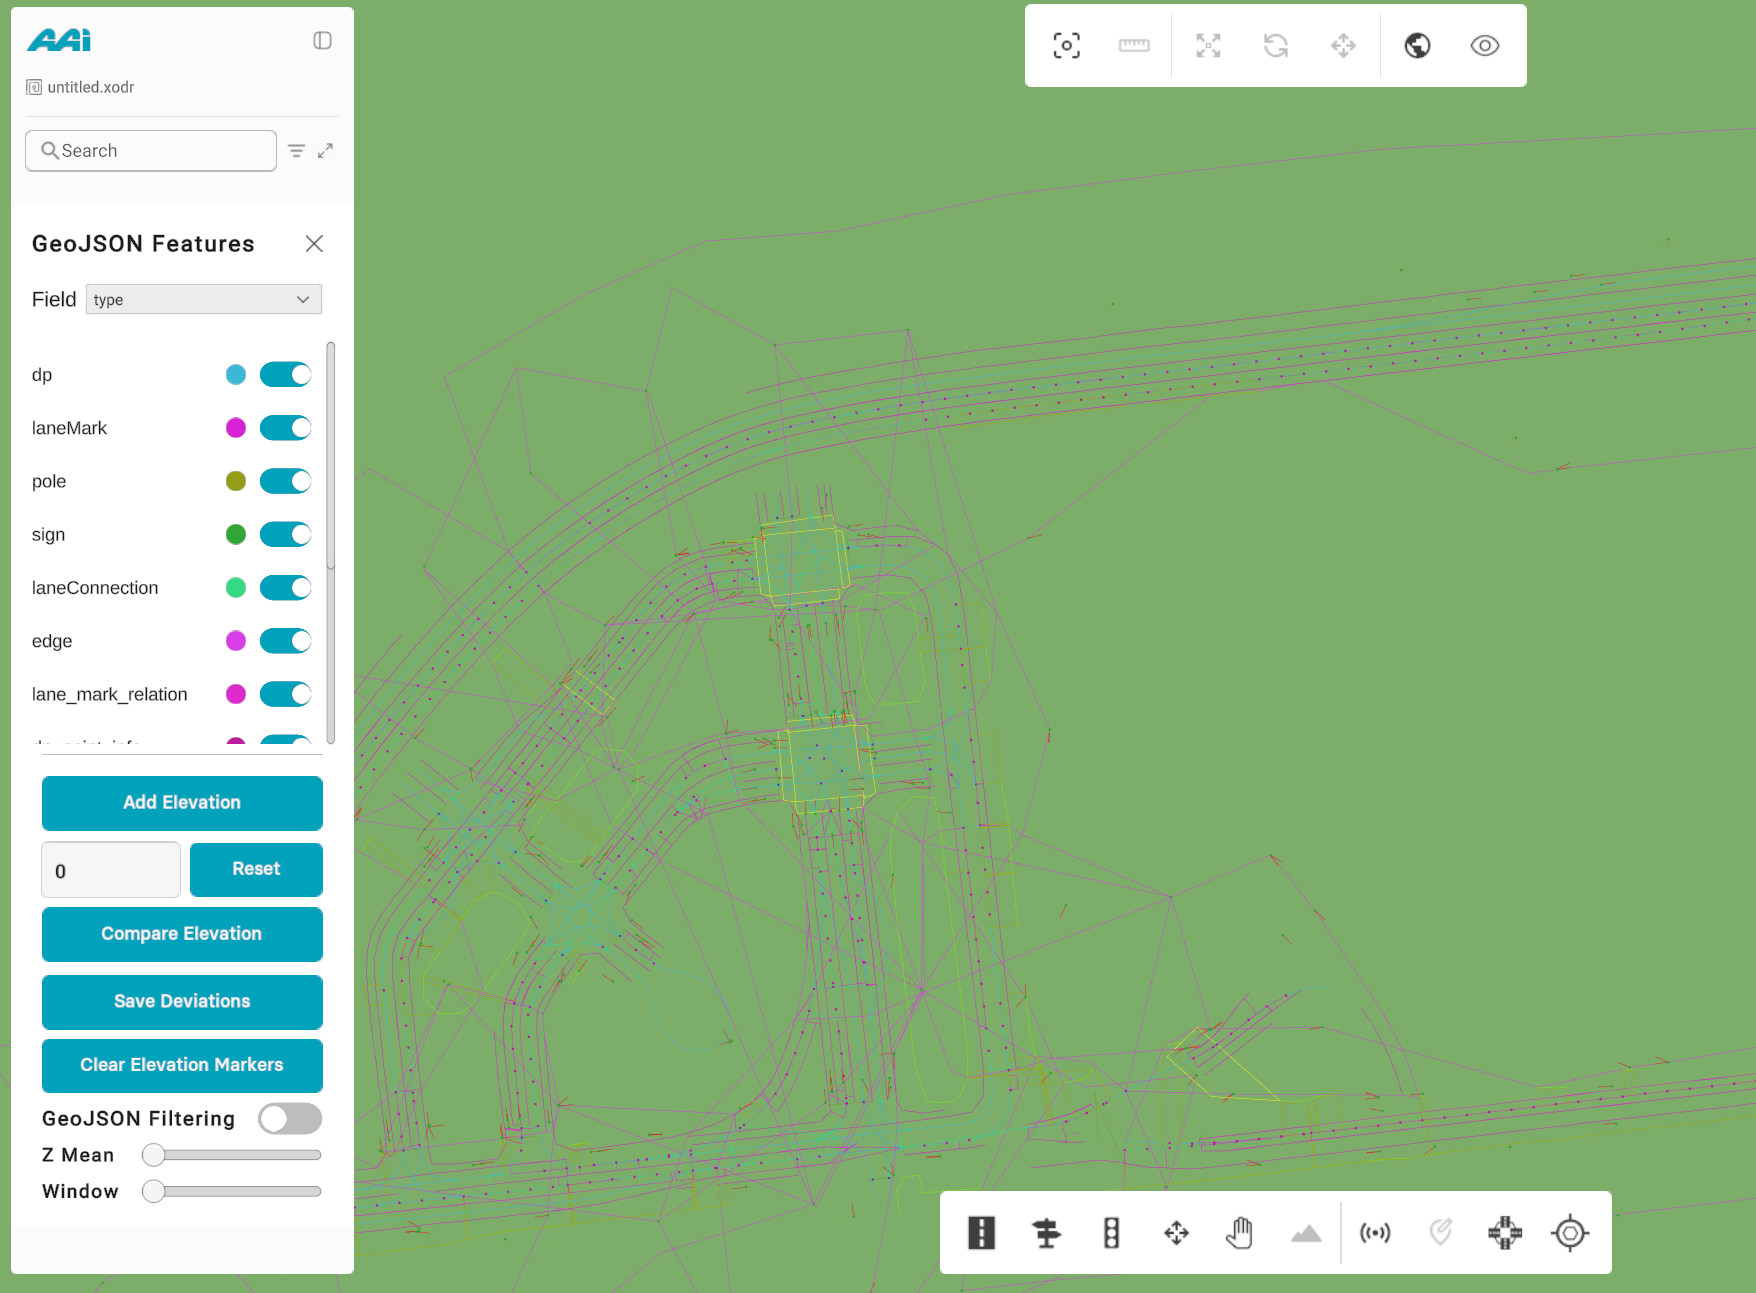
Managing Fields and Types
Inside the GeoJSON Features panel:
- The Field dropdown contains all previously selected fields.
- When a user selects a specific field, its types (unique values within that field) are displayed below.
- Each type includes:
- A color indicator showing its assigned visualization color on the map.
- A toggle switch to control visibility (ON/OFF) directly within the editor.
This enables users to filter visible data dynamically and instantly view corresponding color-coded geometries on the map.
Type Color Customization
Users can personalize how each type appears visually by customizing its color.
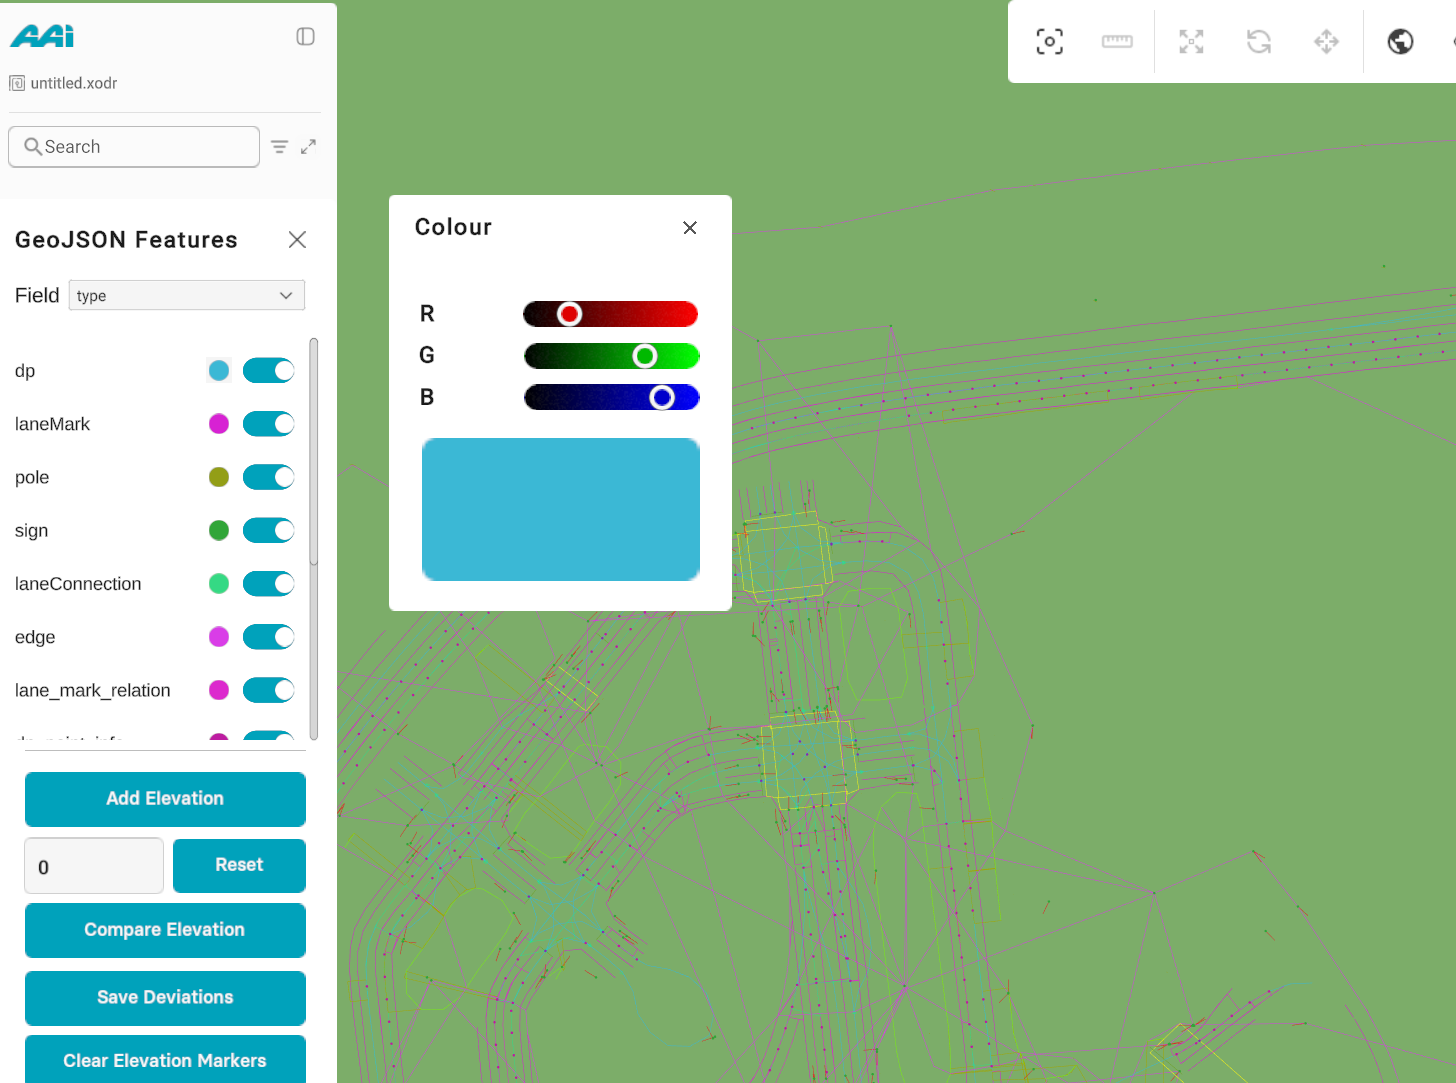
Color Editing:
- Click the color icon beside any type to open the color picker.
- Choose a new color — it immediately updates the visualization of that type in the editor.
Color Conflict Rule: If a type (e.g., edge) exists in multiple fields with different assigned colors: - Only the color associated with the currently selected field in the Field dropdown will be displayed.
Adding Elevation Data
RepliMap allows users to add elevation values to imported GeoJSON geometries, enhancing spatial accuracy for simulation and visualization.
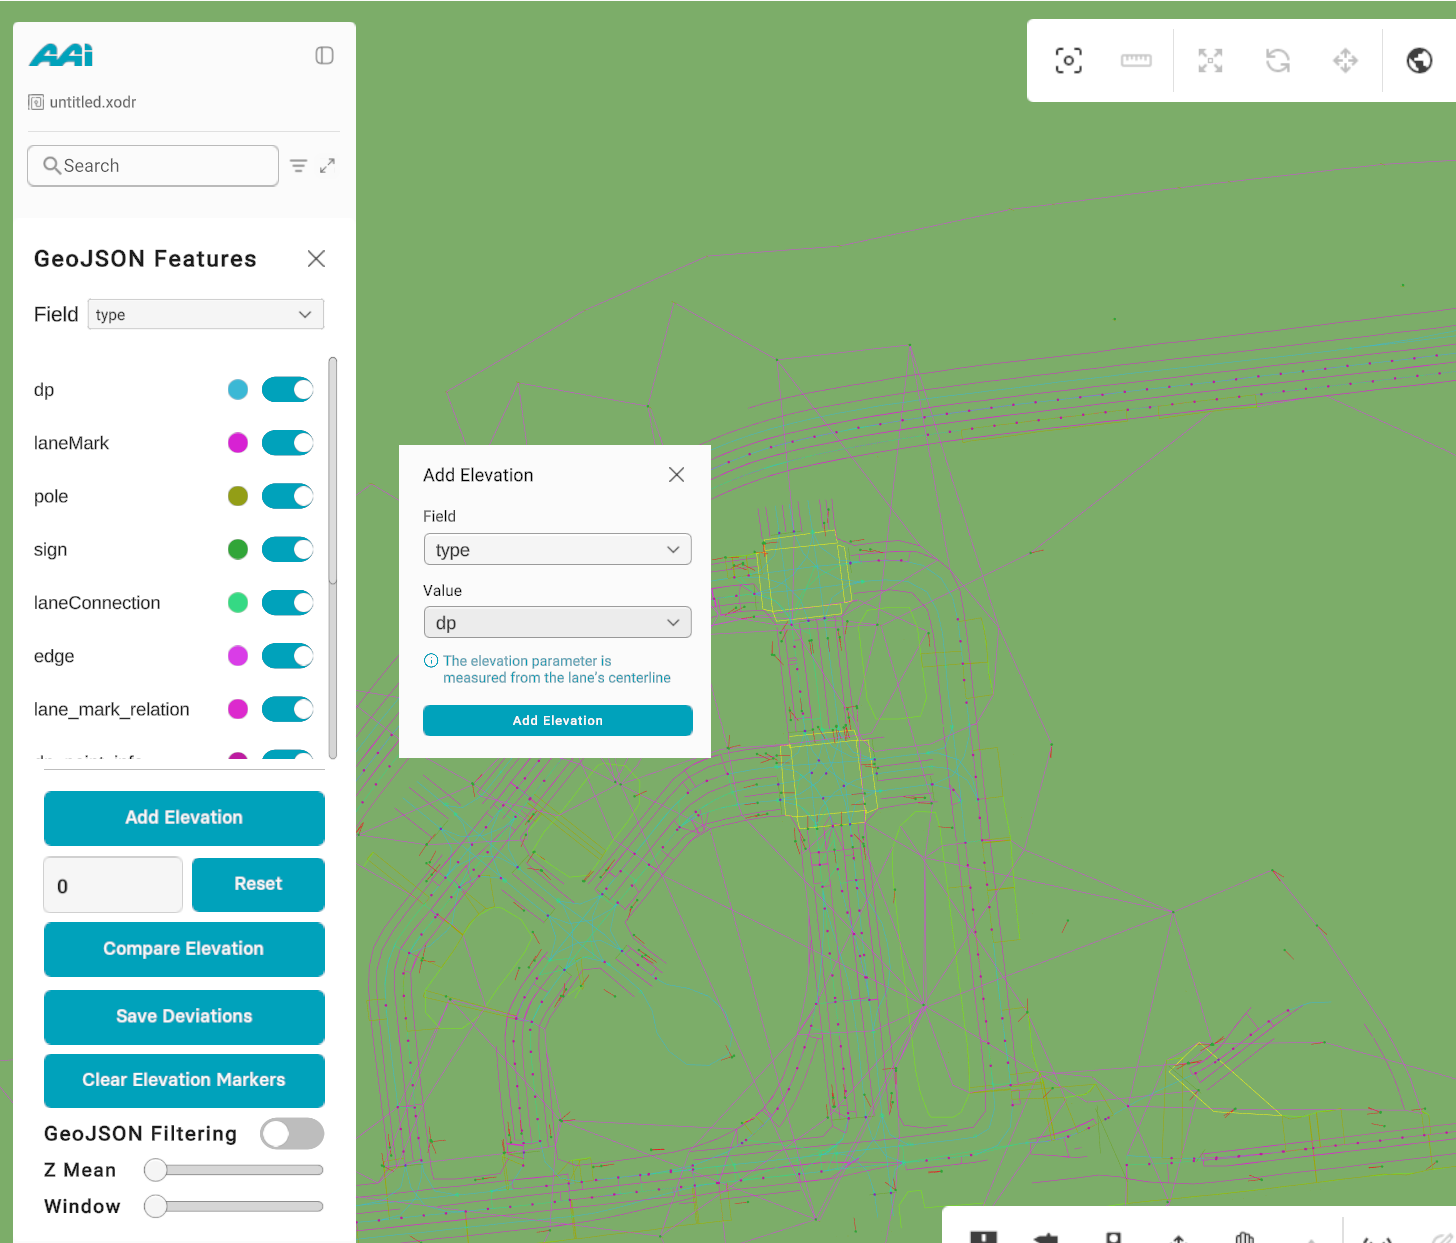
Elevation Editing:
- Click the Add Elevation button located within the GeoJSON Features panel.
- A small dialog box appears, allowing the user to:
- Enter the Field name (e.g., elevation or height).
- Specify a Value representing the elevation in meters.
Once applied, RepliMap automatically updates the selected GeoJSON features, assigning the elevation value and visually reflecting it on the map surface.
This feature is particularly useful for defining terrain-based geometries, bridges, slopes, and 3D map components.
Visualization Behavior
- GeoJSON geometries are color-coded based on the selected field and its types.
- Visibility toggles allow users to focus on specific attributes by hiding or showing relevant geometries dynamically.
- The Add Elevation function ensures imported data aligns with the 3D map surface for enhanced realism.
- This ensures clear, accurate, and elevation-aware visual interpretation of complex spatial data layers.
Summary of Key Features
| Feature | Description |
|---|---|
| Field Filtering | Only fields with values < 30 are selectable. |
| Bulk Actions | “Select All” and “Clear” buttons for quick selection management. |
| Field Review | Preview field names and data types before selection. |
| Type Visibility | Individual toggles to control visibility of each type. |
| Color Customization | Editable color palette for type-based visualization. |
| Add Elevation | Assign custom elevation values to imported GeoJSON geometries. |
| Conflict Resolution | Color priority is given to the currently selected field. |
Benefits
- Enhanced visual clarity and 3D accuracy of imported GeoJSON data.
- Selective visibility for focusing on specific spatial attributes.
- Customizable colors for clearer map analysis and presentation.
- Simplified elevation management for terrain-aware map visualization.
- Reduced visual clutter in large datasets by filtering irrelevant fields.
Export Versioned ODR
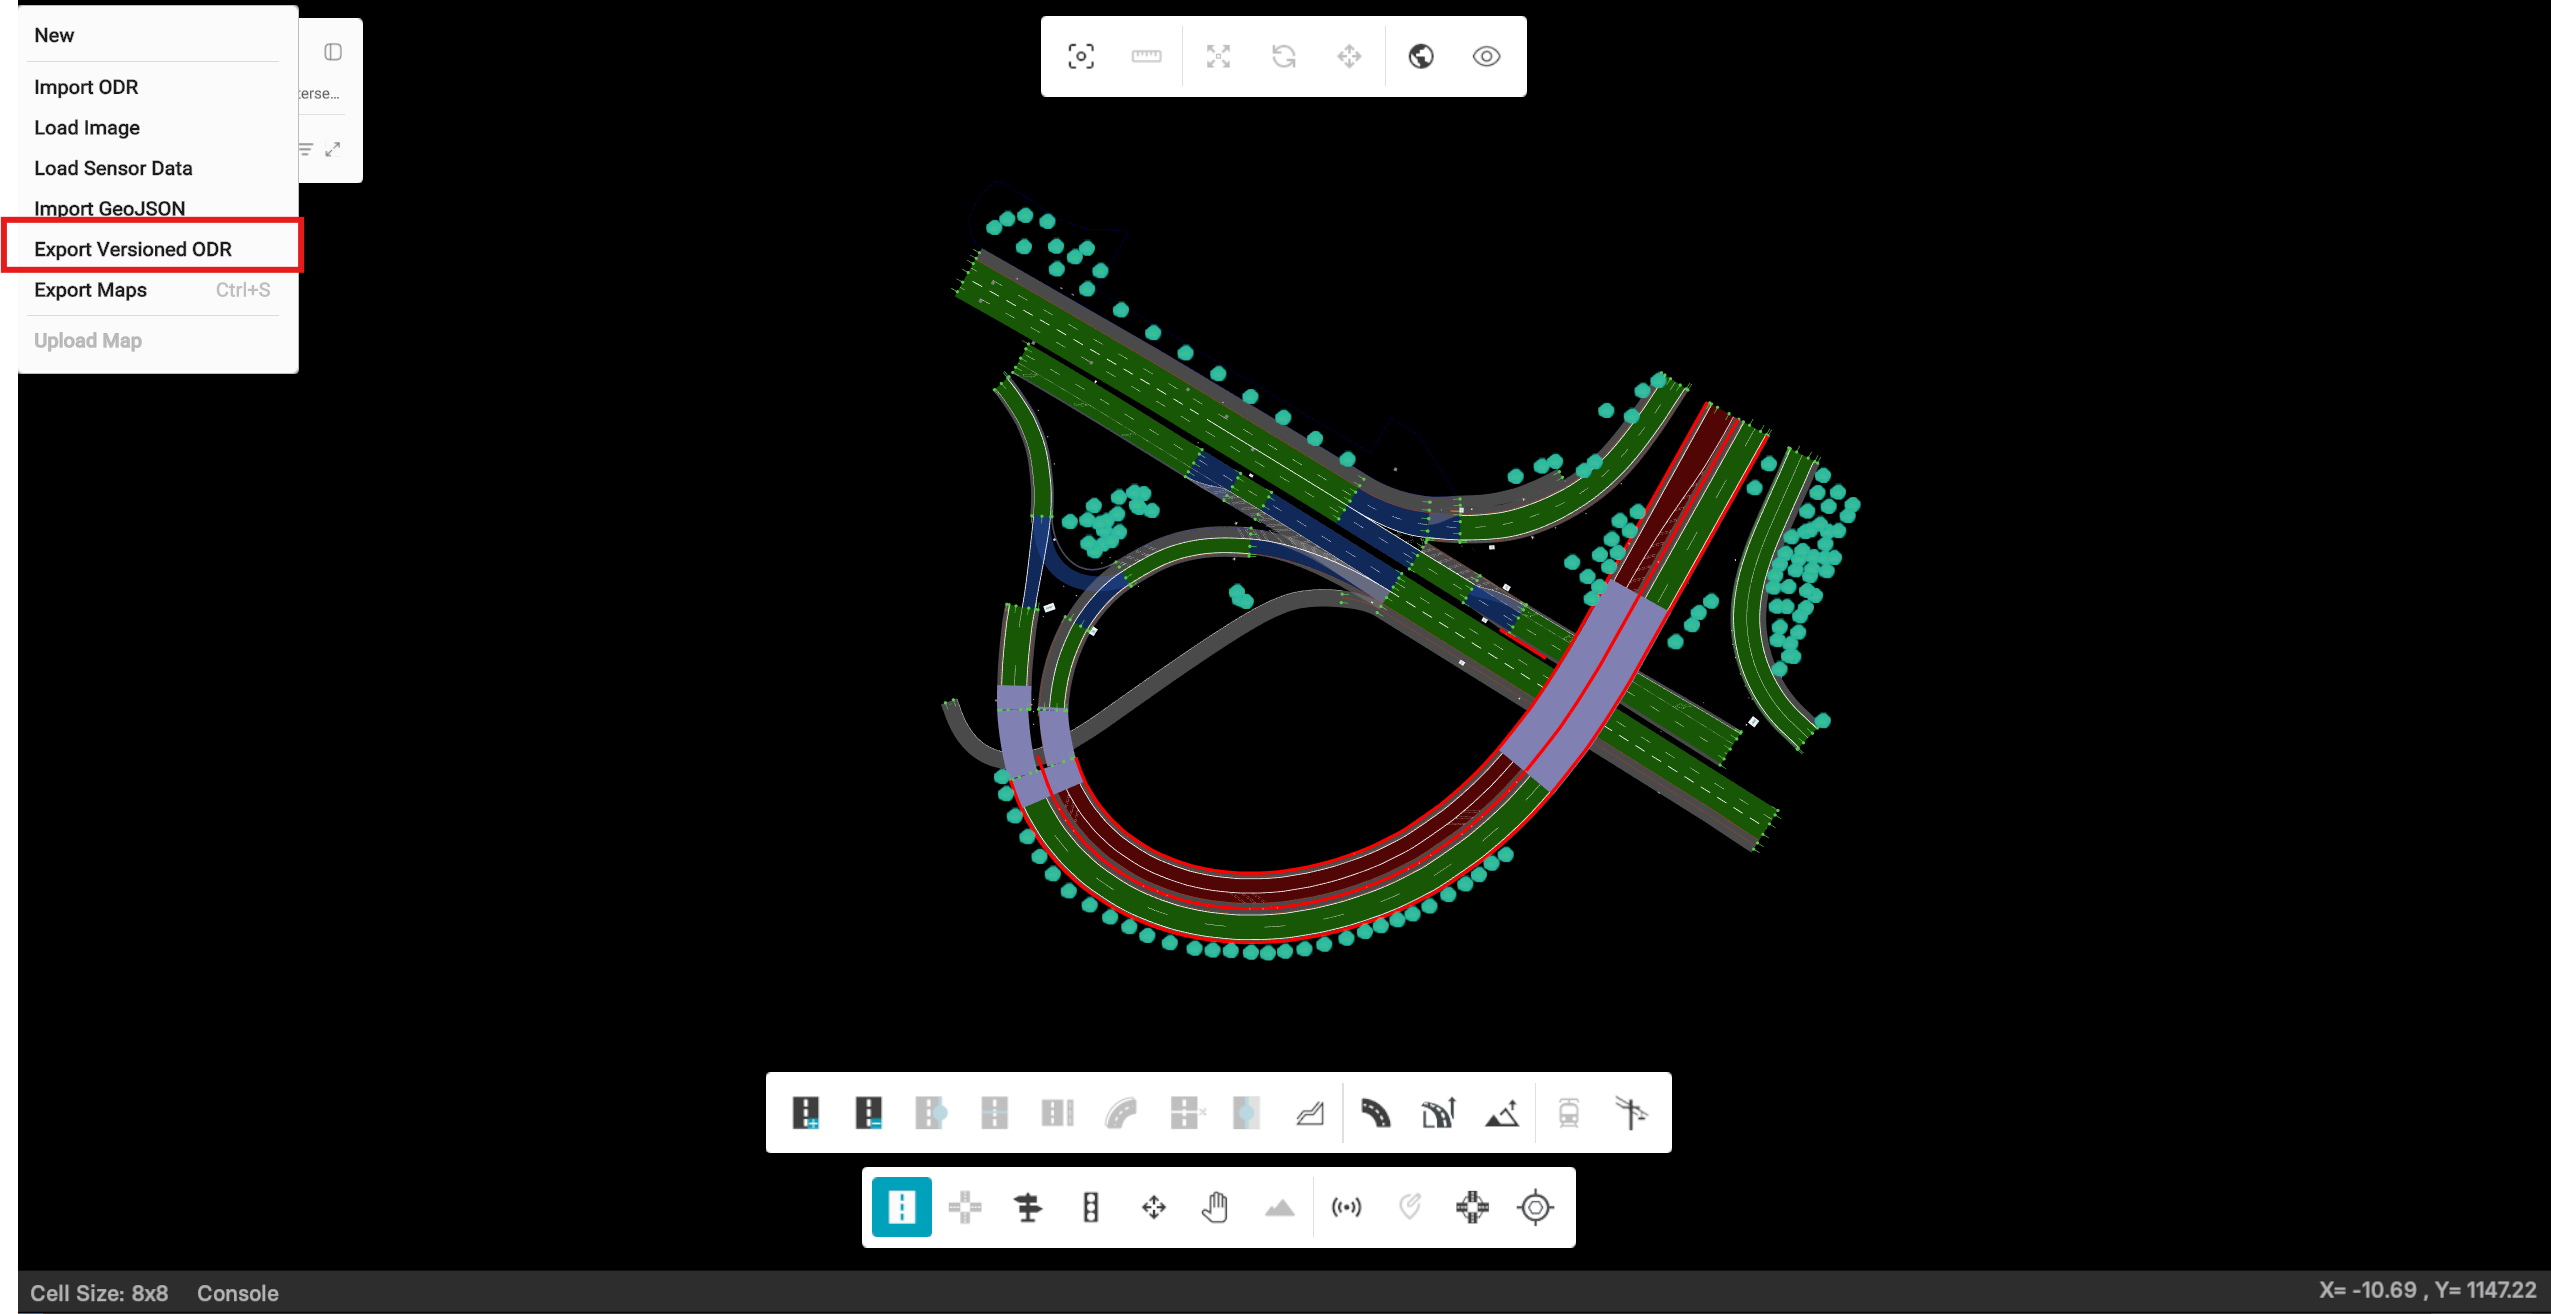
The Export Versioned ODR panel allows users to export customized OpenDRIVE (XODR) map versions for multiple target tools, including 3D Simulation, ModelDesk, and RoadRunner.
This export process ensures compatibility across tools and helps resolve map consistency issues detected in DSpace or similar validation environments.
Overview
The export panel provides flexible options to manage road-level corrections and export configurations before generating map files.
Export Types
The system generates up to four versioned ODR files during export:
- 3D Simulation ODR — complete file for 3D visualization and use in simulation tools.
- ModelDesk (Full) — includes all map objects and attributes, ideal for internal validation.
- ModelDesk (Limited) — excludes specific object categories for simplified export or lightweight setups.
- RoadRunner ODR — optimized export for RoadRunner compatibility, maintaining geometry and road connectivity.
Panel Description
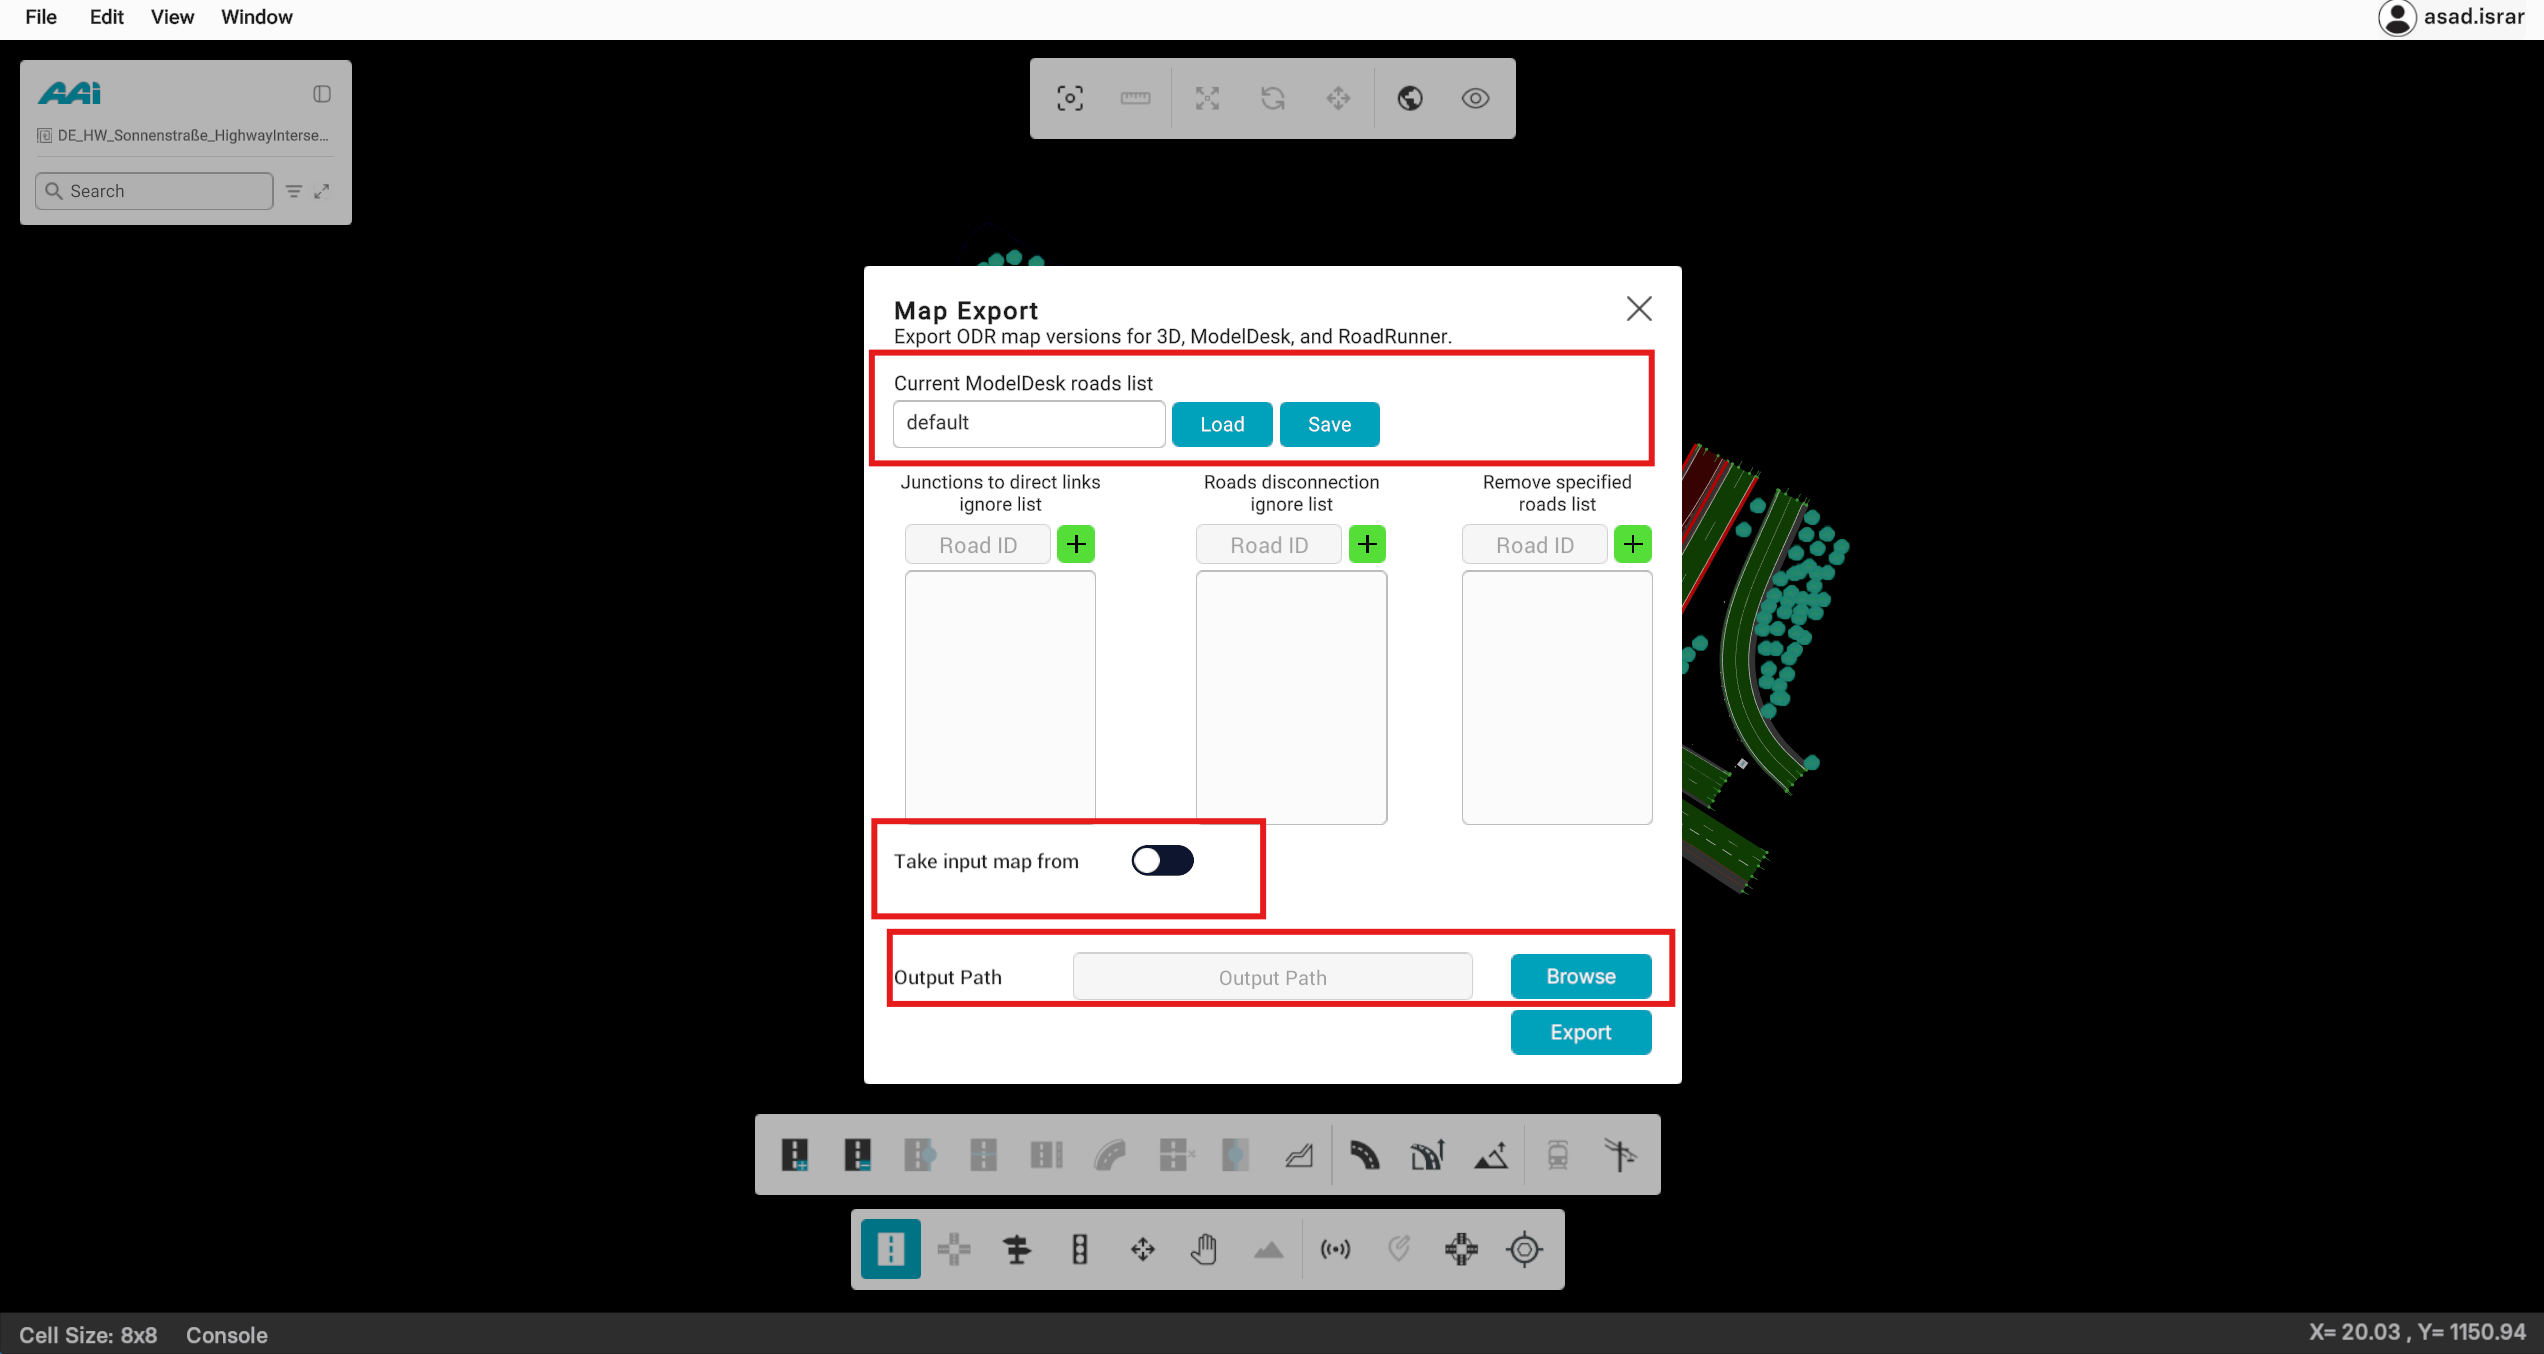
1. Current ModelDesk Roads List
Displays the active road list configuration (default or custom).
Users can Load a previously saved road list or Save a new configuration for later reuse.
2. Road ID Lists (Ignore Lists)
To handle validation issues, users can define road IDs in three ignore lists:
- Junctions to Direct Links Ignore List — used to skip roads causing invalid junction connections
(e.g., single-connecting-road junctions not allowed by ASAM OpenDRIVE). - Roads Disconnection Ignore List — skips roads that cause “disconnection” consistency errors during validation.
- Remove Specified Roads List — excludes selected road IDs completely from the export.
💡 Example:
If DSpace consistency checks highlight red or blue road errors or warnings, simply add those road IDs
to the relevant list and re-export. The new export automatically resolves the reported connection
or geometry conflicts.
3. Take Input Map From (Toggle Option)
- When enabled, users can attach an external road list file to use predefined IDs for ignore lists.
- When disabled, IDs can be manually entered in the fields above.
4. Output Path
Defines the export destination for the generated ODR files.
Use the Browse button to select the target folder.
5. Export Button
Initiates the export process.
The system automatically generates all selected ODR variants (3D, ModelDesk full/limited, RoadRunner).
Typical Workflow
- Open the Export Versionized ODR panel from the export menu.
- (Optional) Load a previously saved ModelDesk roads list configuration.
- Add any road IDs into the ignore lists to bypass invalid junctions, disconnections, or unwanted roads.
- (Optional) Enable Take Input Map From to load IDs directly from an external list file.
- Choose an Output Path for the exported ODRs.
- Click Export to generate all ODR files.
- Load the exported files in your preferred environment (ModelDesk, RoadRunner, or 3D simulation) for verification.
Benefits
- Streamlined handling of consistency check errors (e.g., red/blue connection issues).
- Ensures ModelDesk and RoadRunner compliance in one unified export workflow.
- Allows fine-grained control with custom road exclusion lists.
- Reduces manual rework by saving reusable road ID configurations.
Export Maps
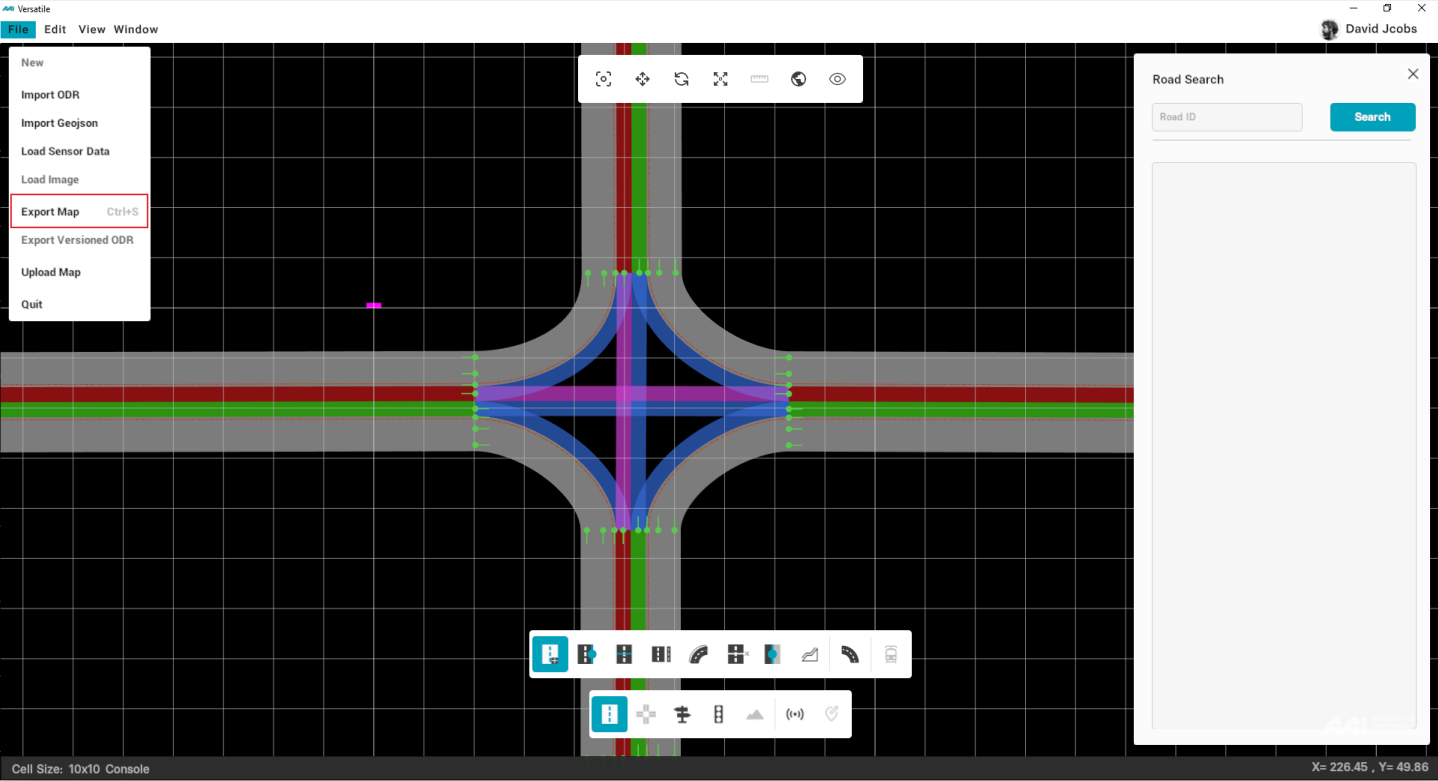
Once you have created or opened a map in RepliMap, you will be able to export your map by pressing CTRL + S from your keyboard or by simply following the given steps:
1. Click on "File", select "Export Map" from the drop-down menu.
2. When a dialog box appears on screeen, choose a file destination from the list of folders and type the desired file name in "Filename" entry box.
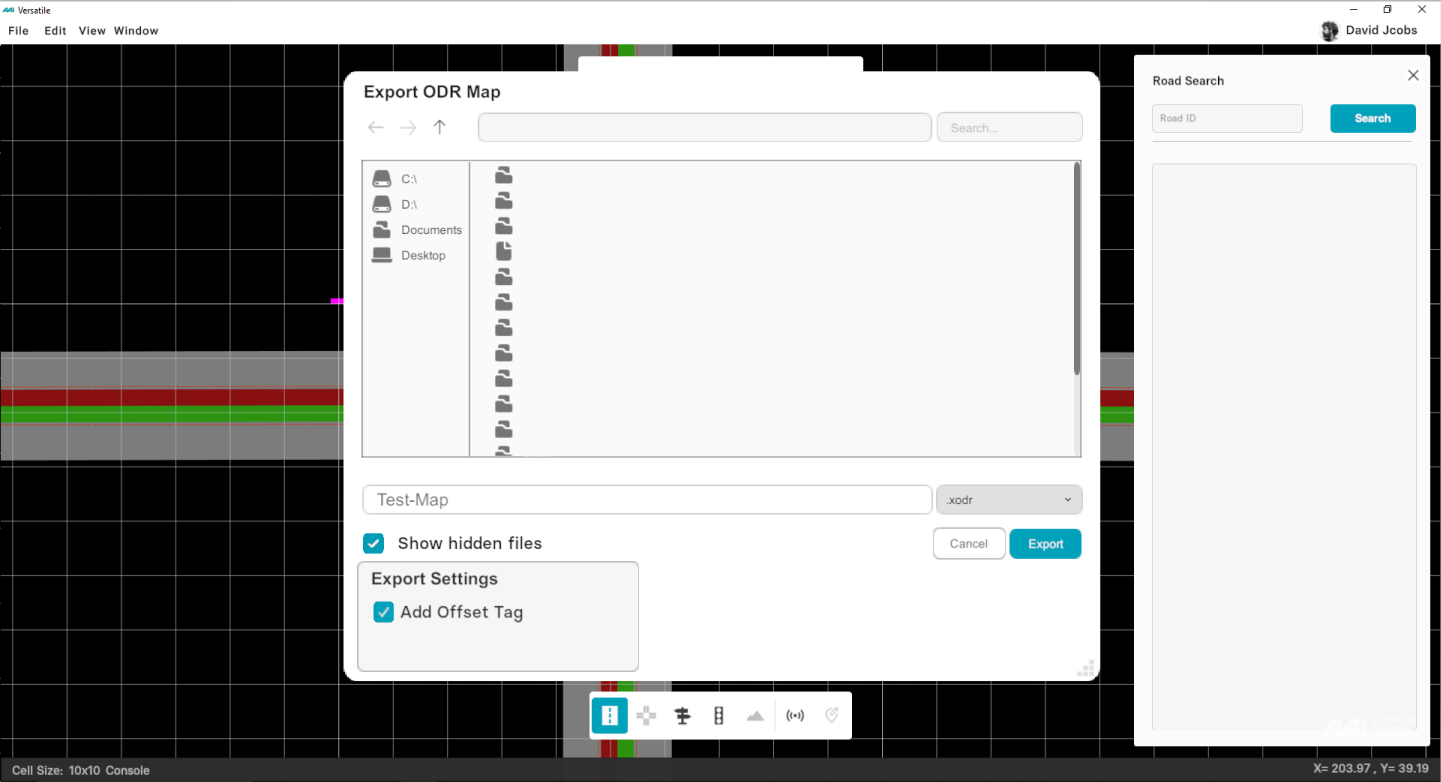
3. Press"Enter" from your keyboard or click "Export" to save your map. The map is saved in the *.xodr file format, which can be opened up later by RepliMap.

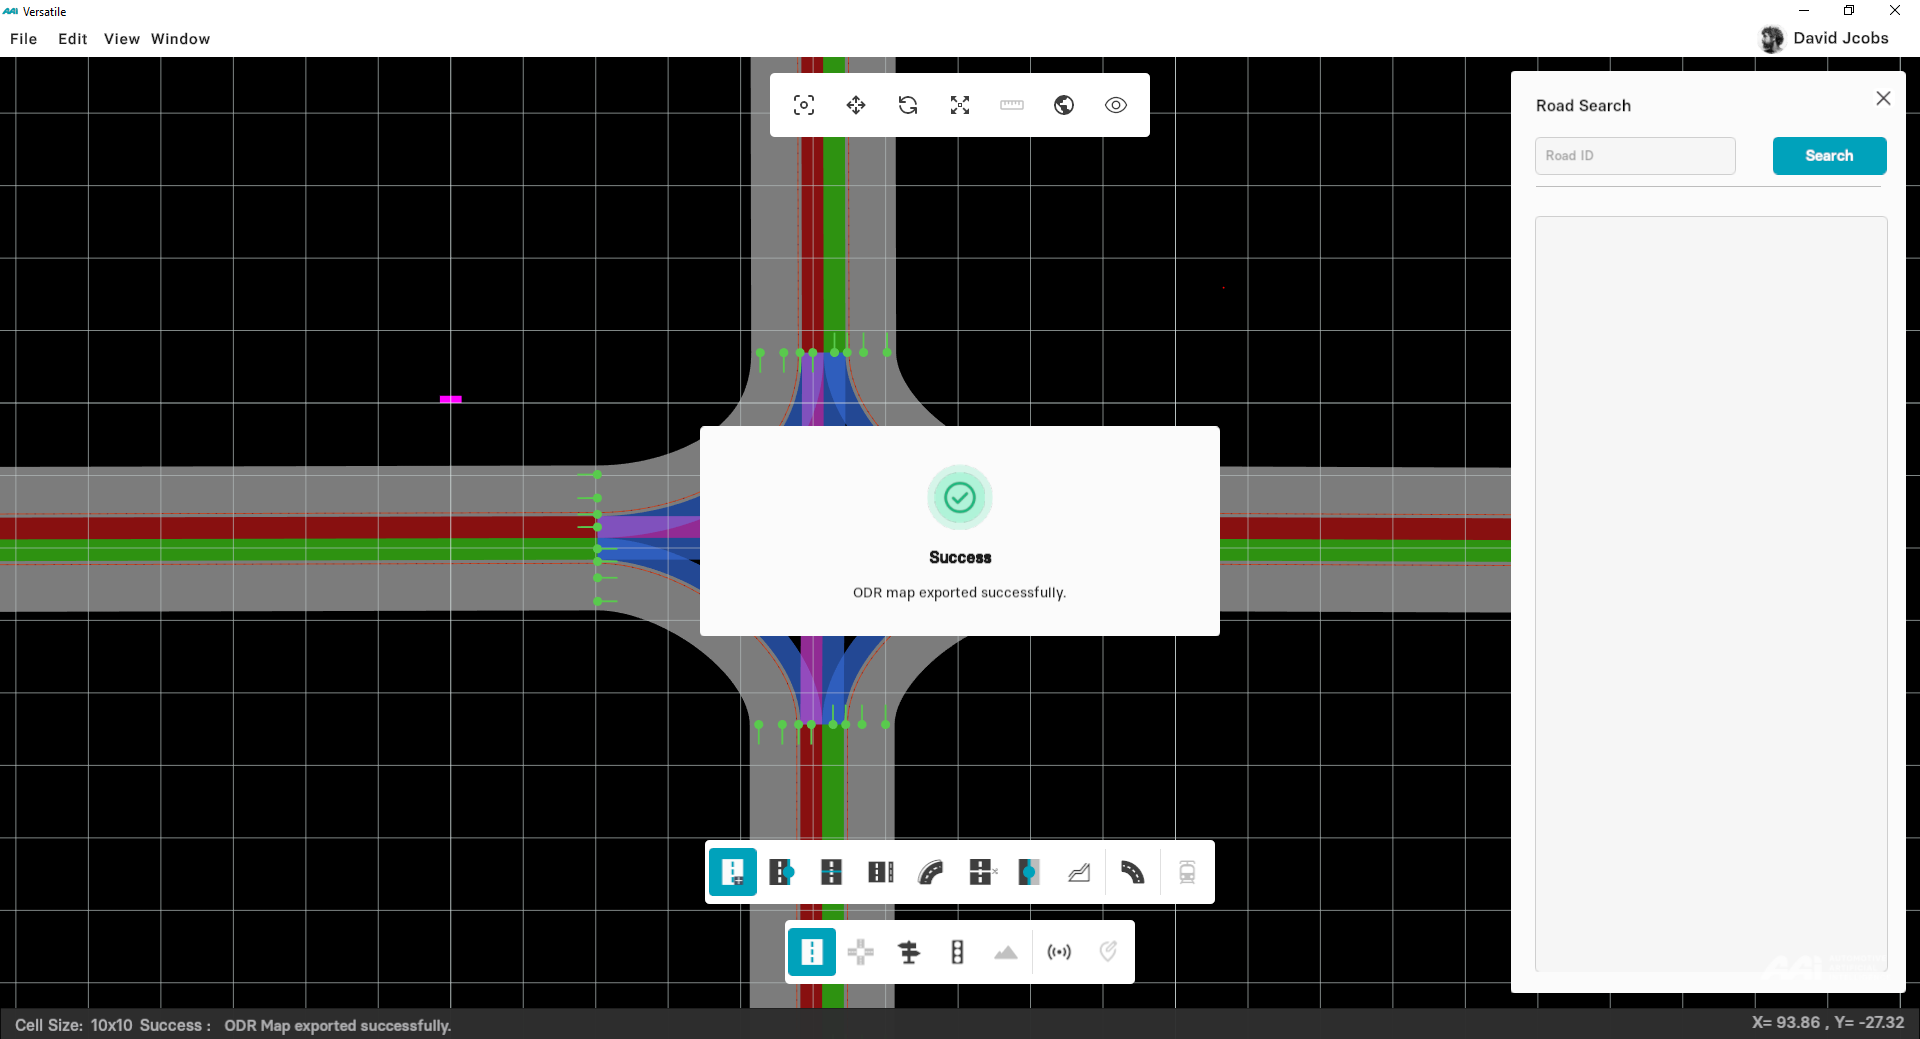
4. A prompt message "Exported Successfully" appears on your screen.
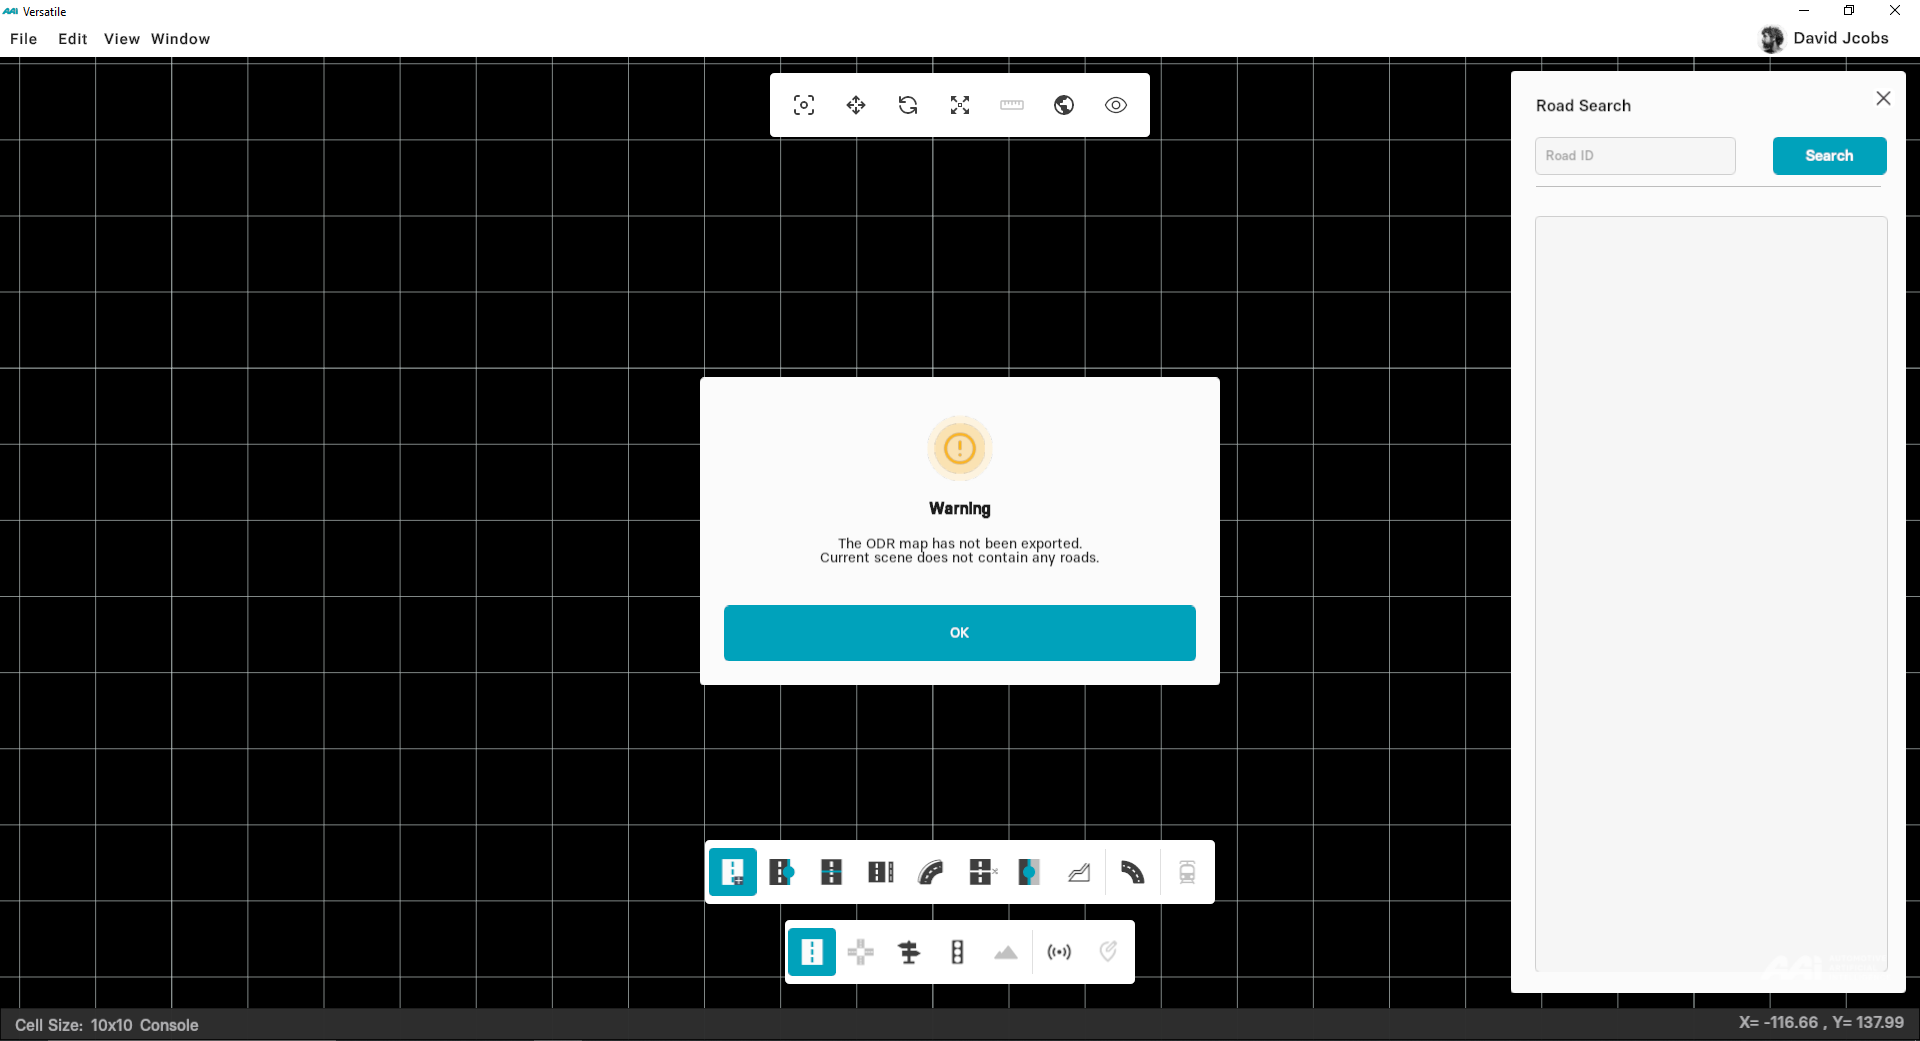
Before exporting, make sure your RepliMap window is not empty. Otherwise, a warning alert pops up on the screen.
Upload Map
Information is currently unavailable in the latest RepliMap version.
Edit
The Edit drop-down menu, provides operations such as Undo last change and Redo last undone change from your currently opened map in RepliMap. Note: Undo/Redo is not supported with imported maps.
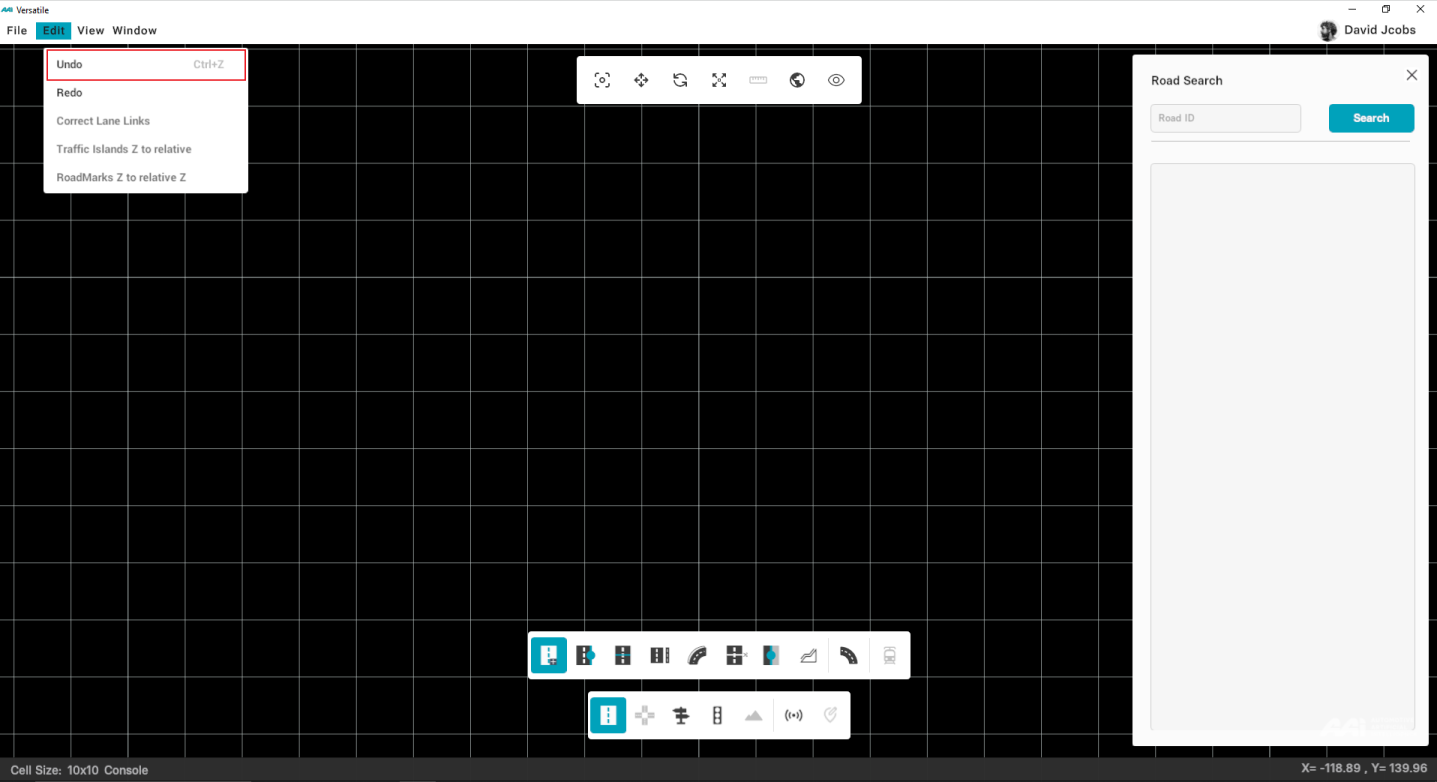
Undo
To undo the changes, simply press "CTRL+Z" from your keyboard or click on "EDIT"in the Menu Bar and select "UNDO" as shown in figure below.
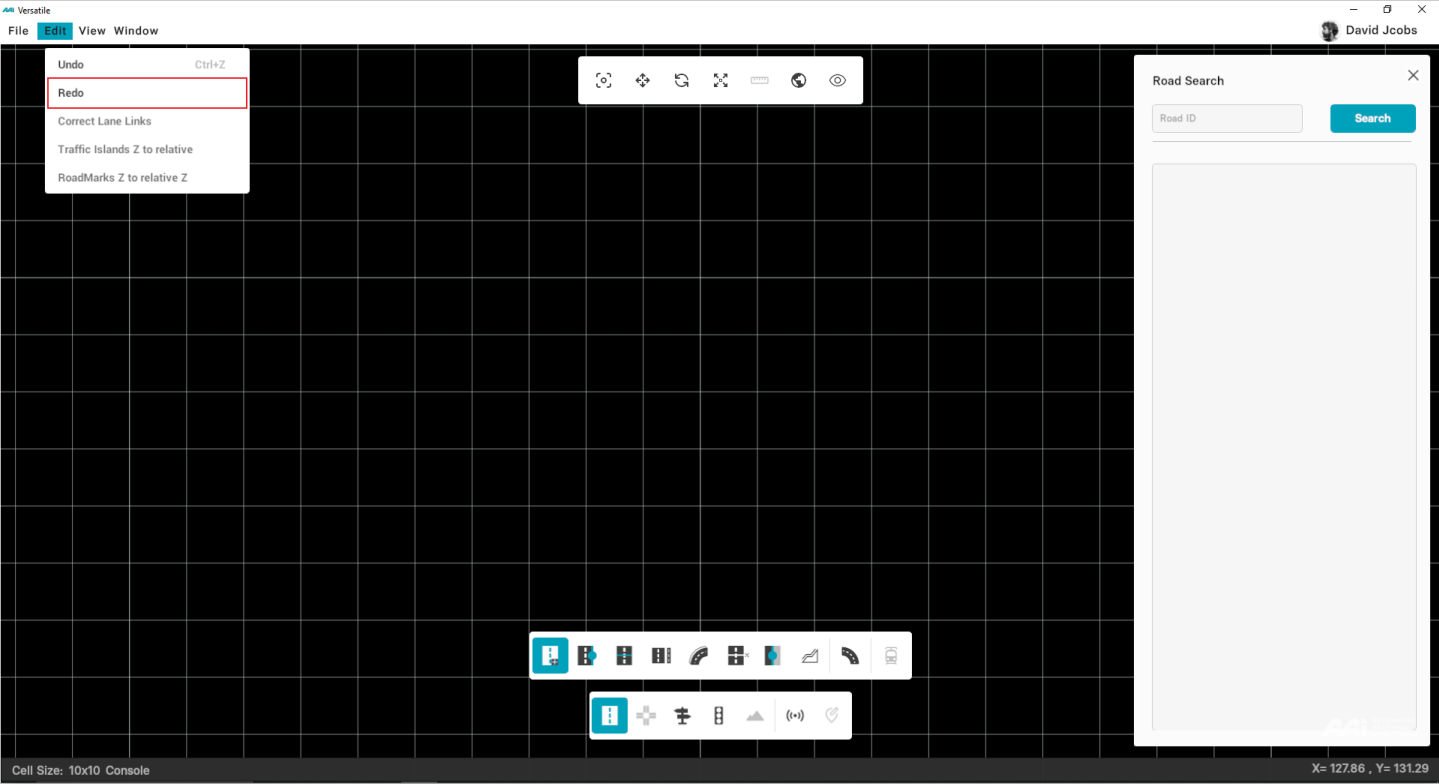
Redo
To redo the changes, simply press "CTRL+Y" from your keyboard or click on "EDIT"in the Menu Bar and select "REDO" as shown in figure below.
Correct Lane Links
Goes through the entire map that are not logically connected and tries to connect the links. Shows the status in the console logs. This tool is not advisable and is subject to further development.

Traffic Islands Z to relative Z
It allows the users to modify the traffic islands (if any) in congruence with the roads’ elevation. If variations after the process do not match, manually will be required.
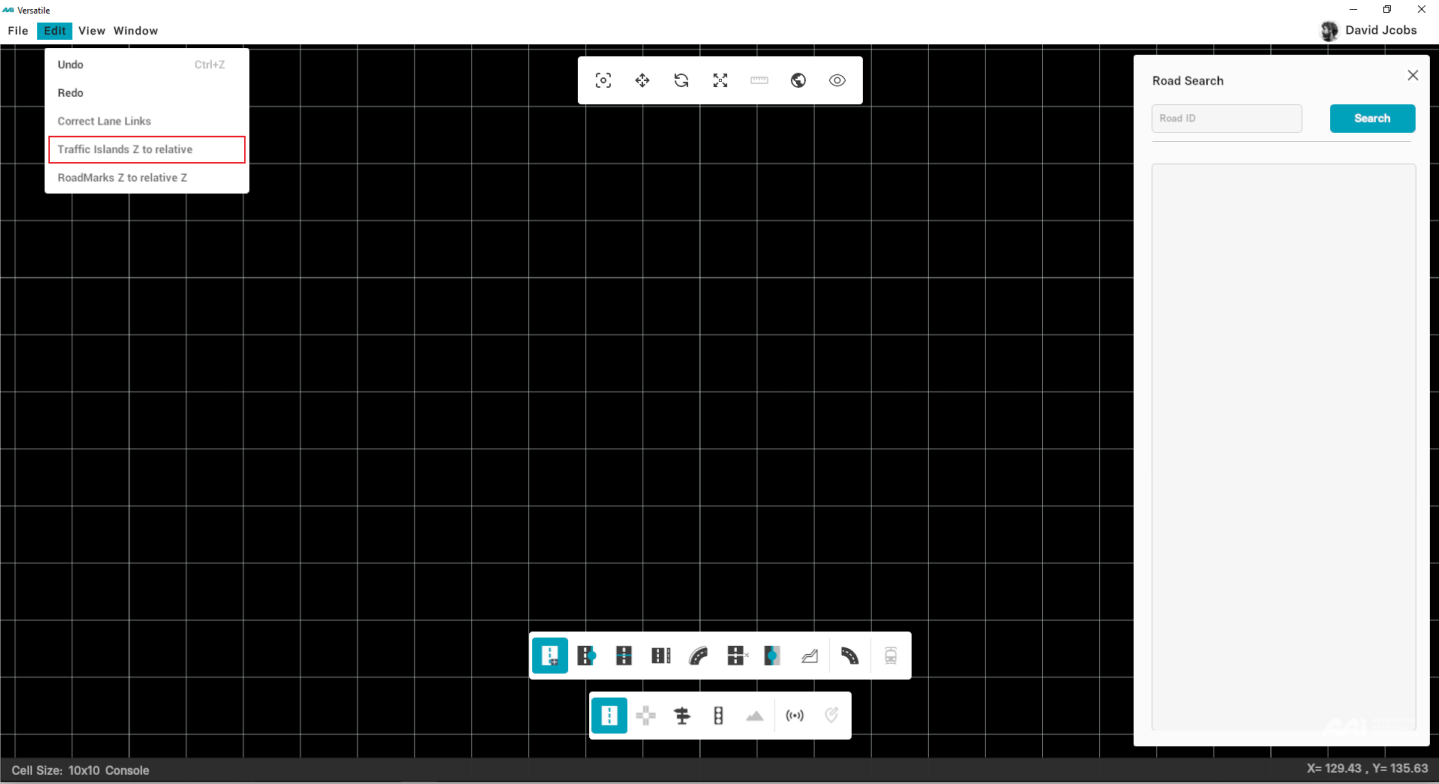
Can only be done once per session.
RoadMarks Z to relative Z
Mainly used and required for super elevation. Allows the already-existing road marks to stay with the road's elevation complexity.
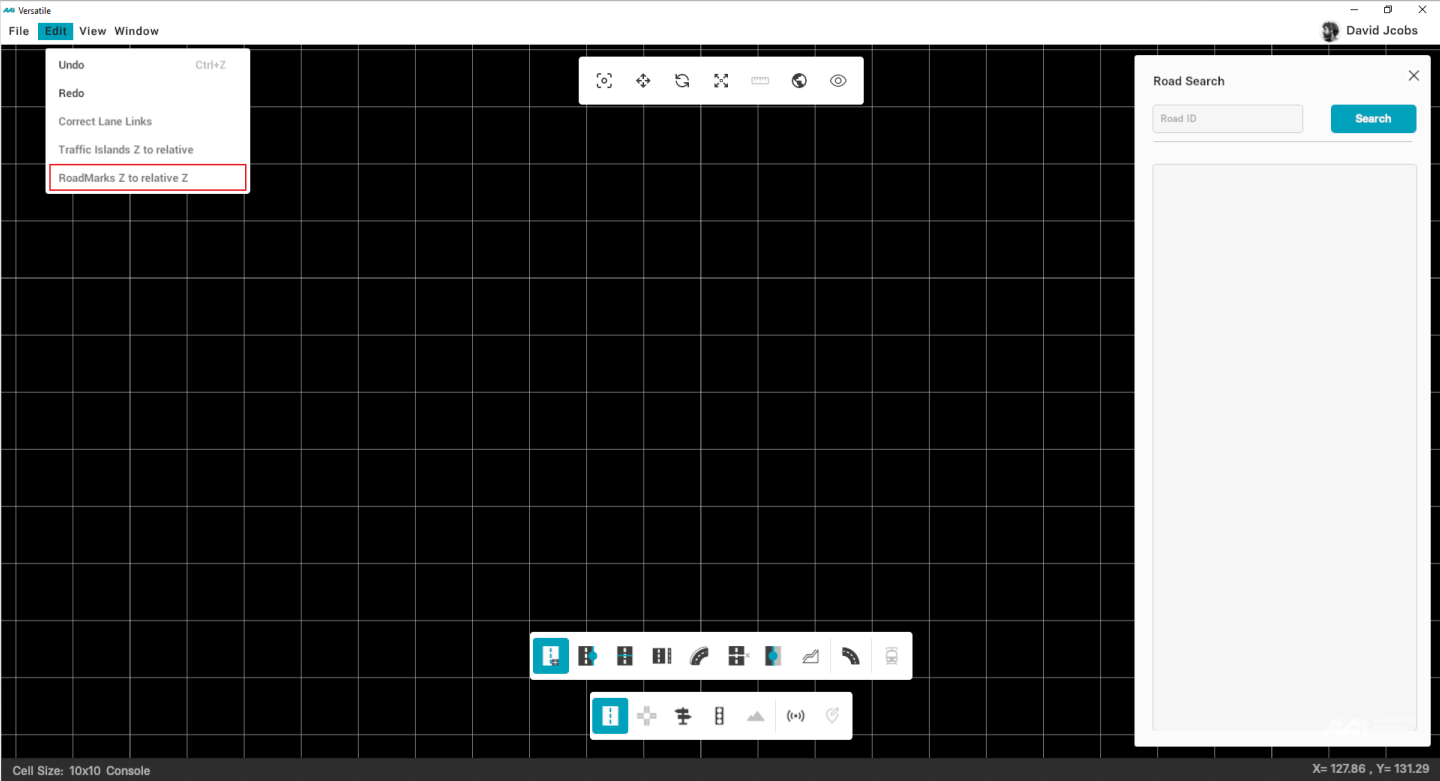
Can only be done once per session.
View
A horizontal bar located at the top-left of the menu bar, provides you a variety of functions. Kindly note the listed.
- Grid
- Static Grid
- Zoom Handle
- Toggle Slots
- Toggle Controls
- Toggle GeoJson
- Toggle Map Colors
- Toggle Map Icons
- Toggle Helper Roads
Grid
This command lets you enable or disable the grid view from the menu bar as shown in figure 2.13 given below.
Click on "View" from menu bar at top-left of the window. Select "Toggle Grid" from drop-down menu. Or simply click "CTRL+G" from your keyboard.


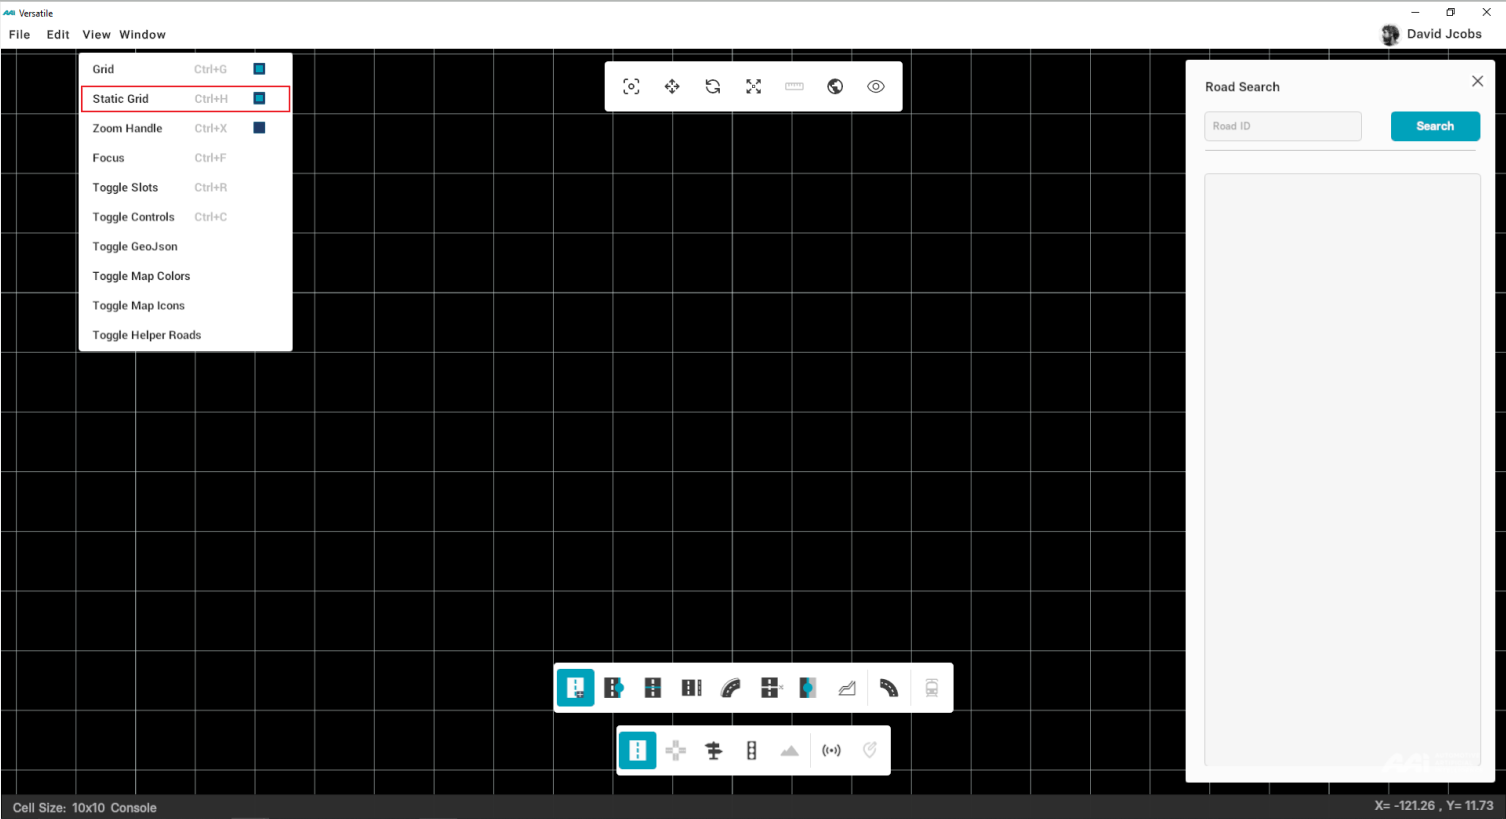
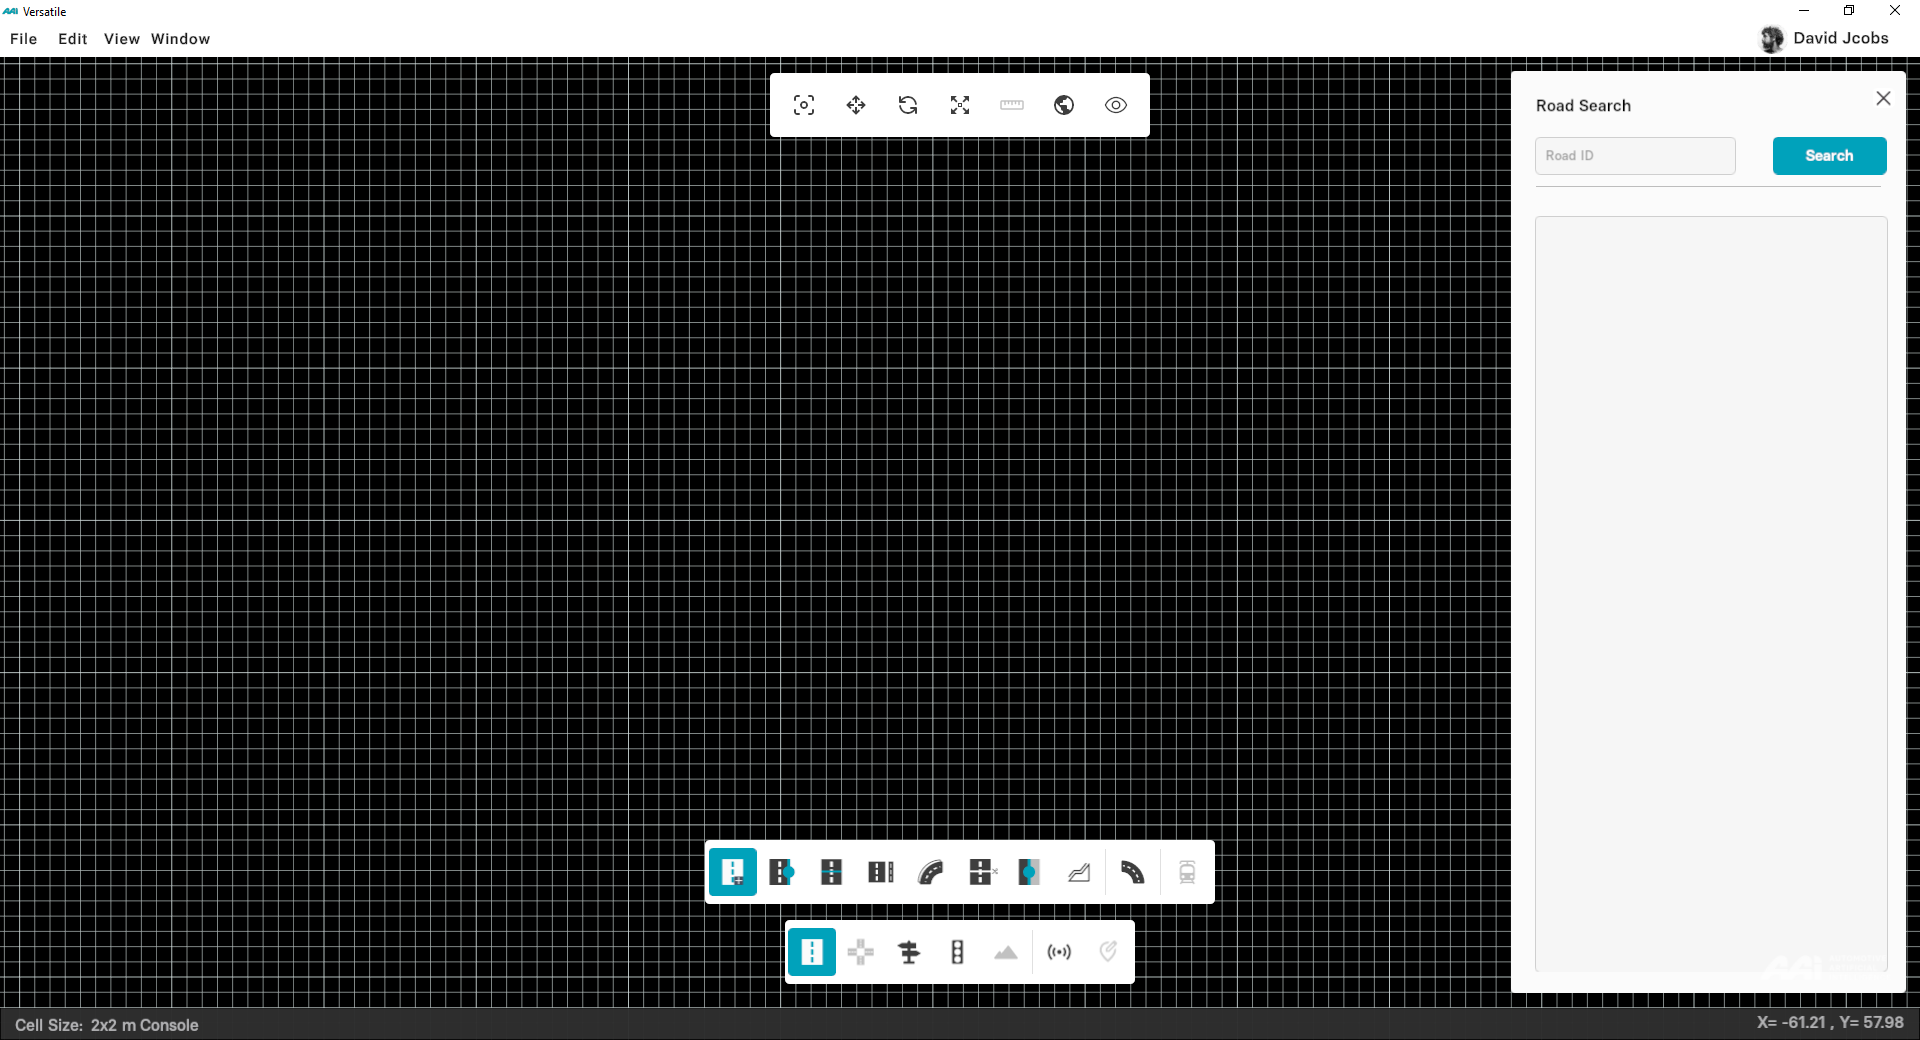
Static Grid
This option toggles the grid between static and dynamic XXX. Click on Toggle Static Grid from View in Menu bar or press CTRL+H from your keyboard. By default, grid is set to static position.
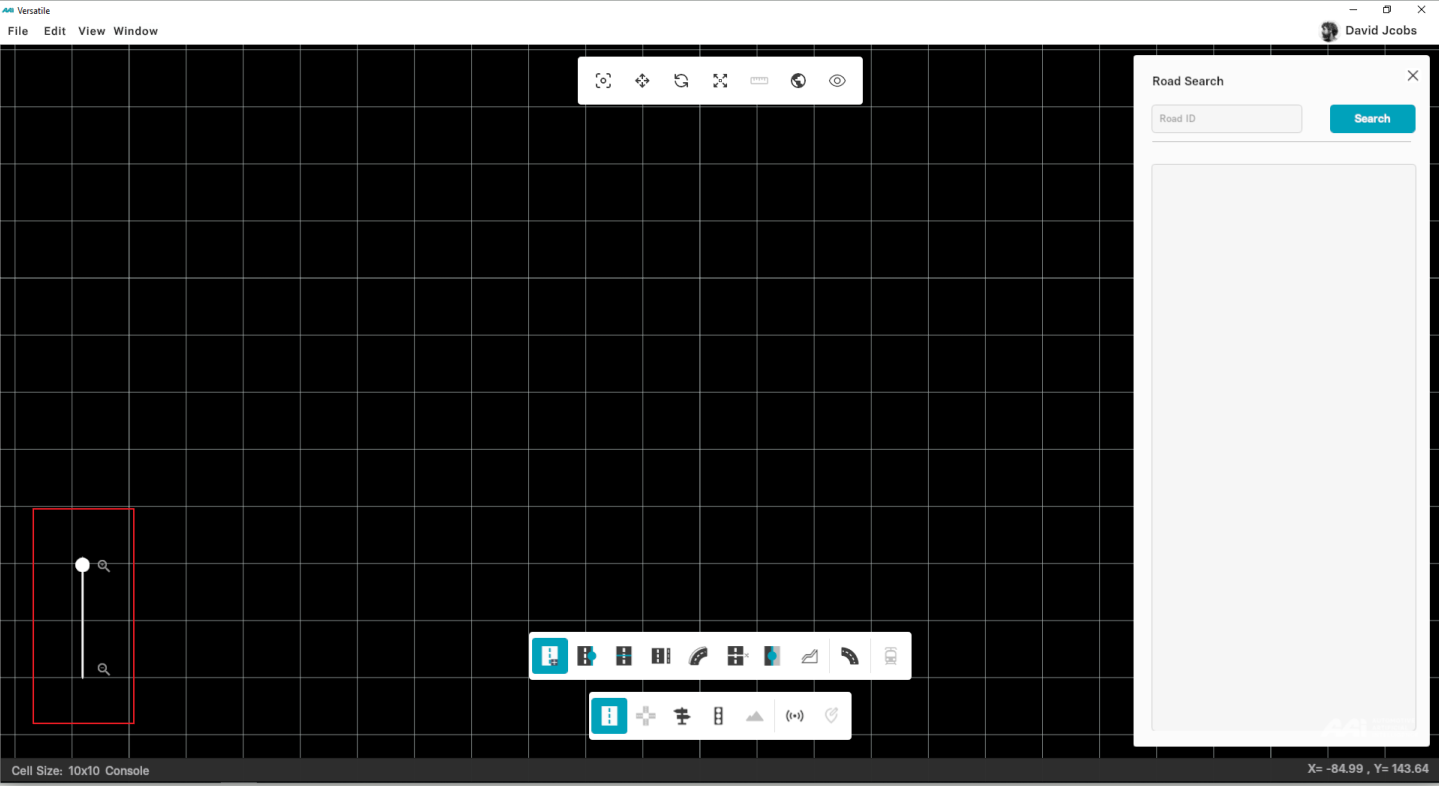
Zoom Handle
To zoom in and out a map, place the mouse over the desired location and rotate (or scroll) your mouse wheel forwards or backwards respectively. You can also zoom in or out by using the zoom handle at the bottom-left corner of the screen as illustrated in figure 2.17 below.
1. Go to "View" at the top-left of the window, select "Zoom Handle" from drop-down menu. Or, press "CTRL+X" from your keyboard.

2. A bar appears at the bottom-left of the menu bar with a draggable knob on it, left-click on the knob to drag it over the bar to adjust the zoom.
Focus
Go to "View" at the top-left of RepliMap window, select "Focus" from the drop-down menu, or simply press "CTRL+F" from your keyboard to zoom in main grid window.

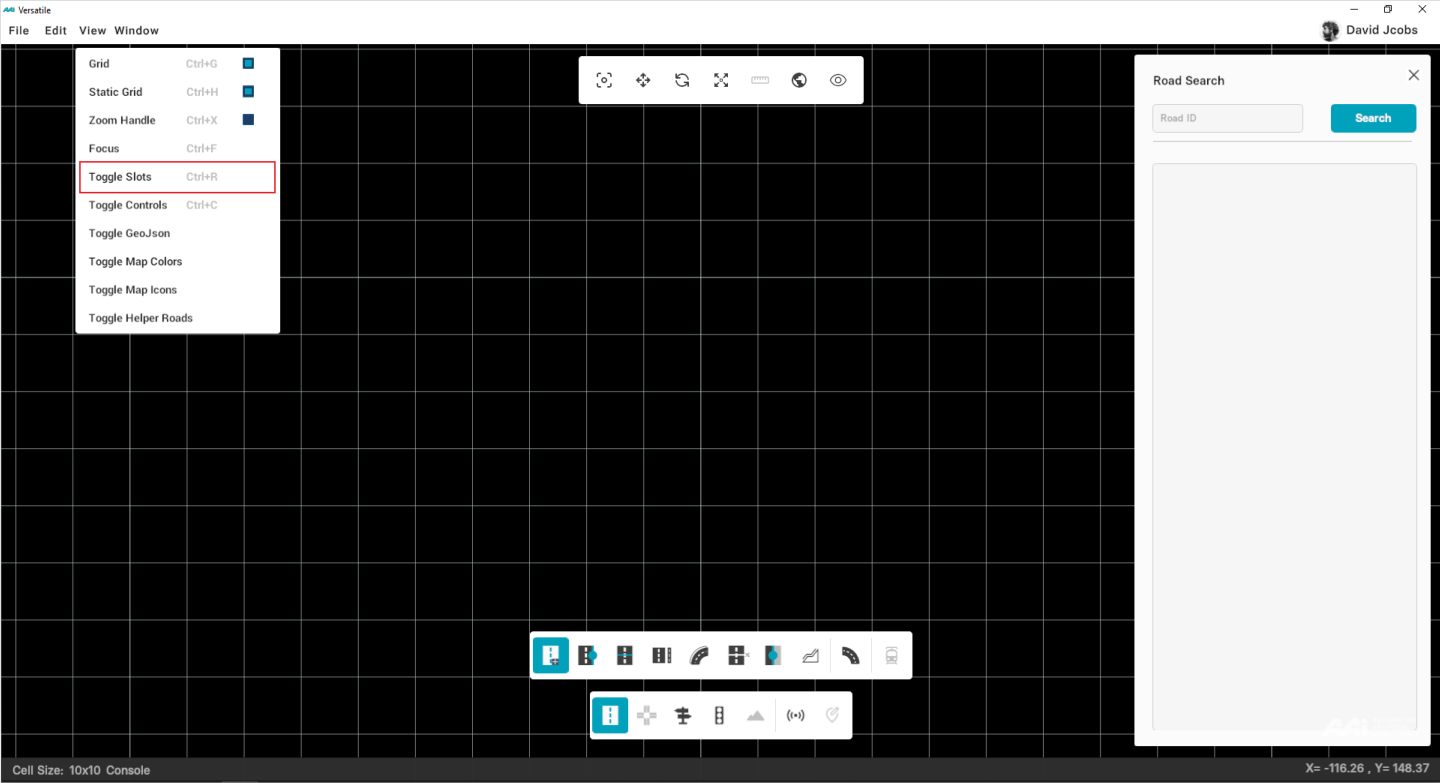
Toggle Slots
This function enables users to visualize a deeper-levelled grid in the mapping tool for better alignment references. For convenience, the function is linked to the shortcut “Ctrl+R”.
Toggle Controls
This function toggles the visualization of curvature and bezier control when entering the Road section. For convenience, the function is linked to the shortcut “Ctrl+C”. As of 29/05/2024, shortcuts for this feature are disabled.

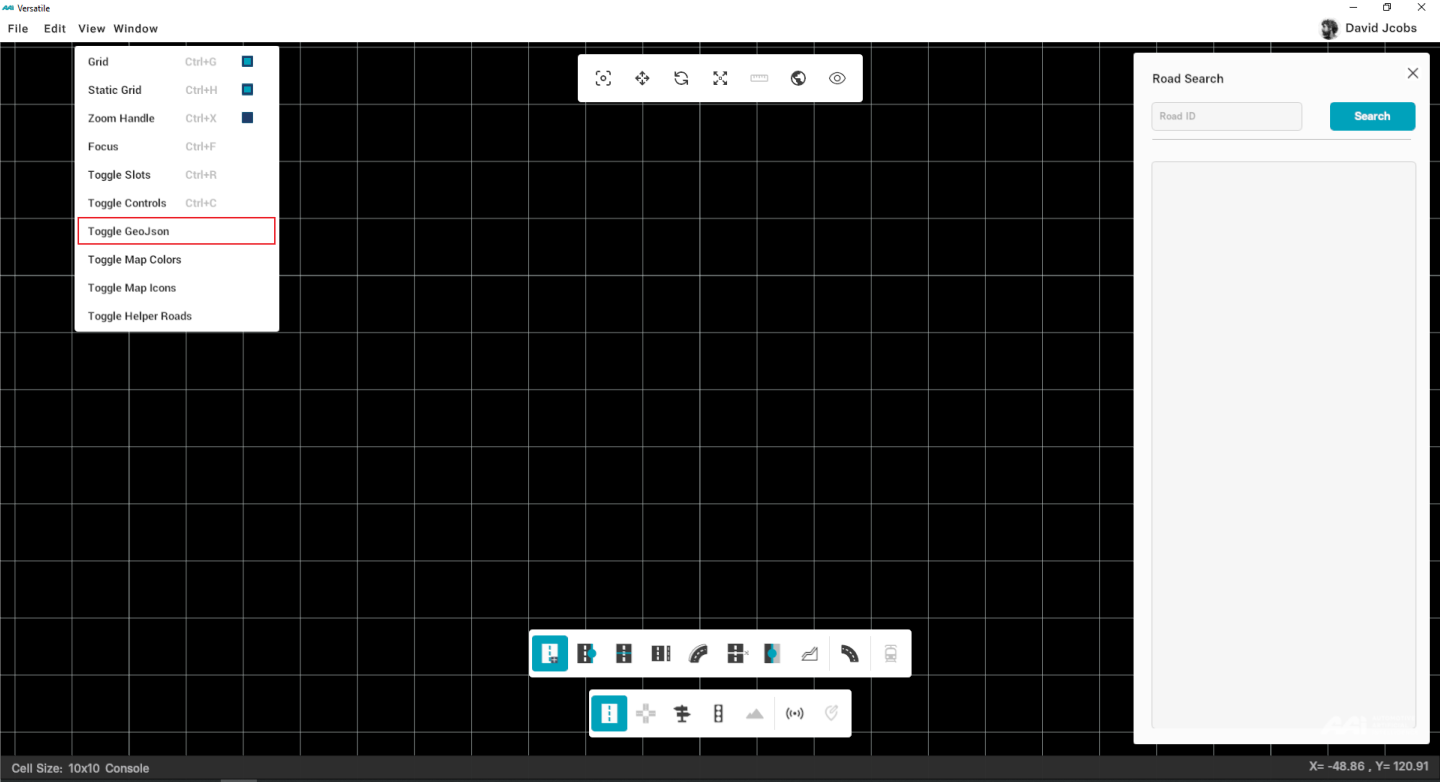
Toggle GeoJson
This function toggles the visualization of the imported GeoJson data for necessary in-depth development.
Toggle Map Colors
This function toggles an alternative view of the ODR file, enhancing comprehensibility, particularly in complex scenarios. It aids in better distinguishing lane sections and markings for improved clarity.

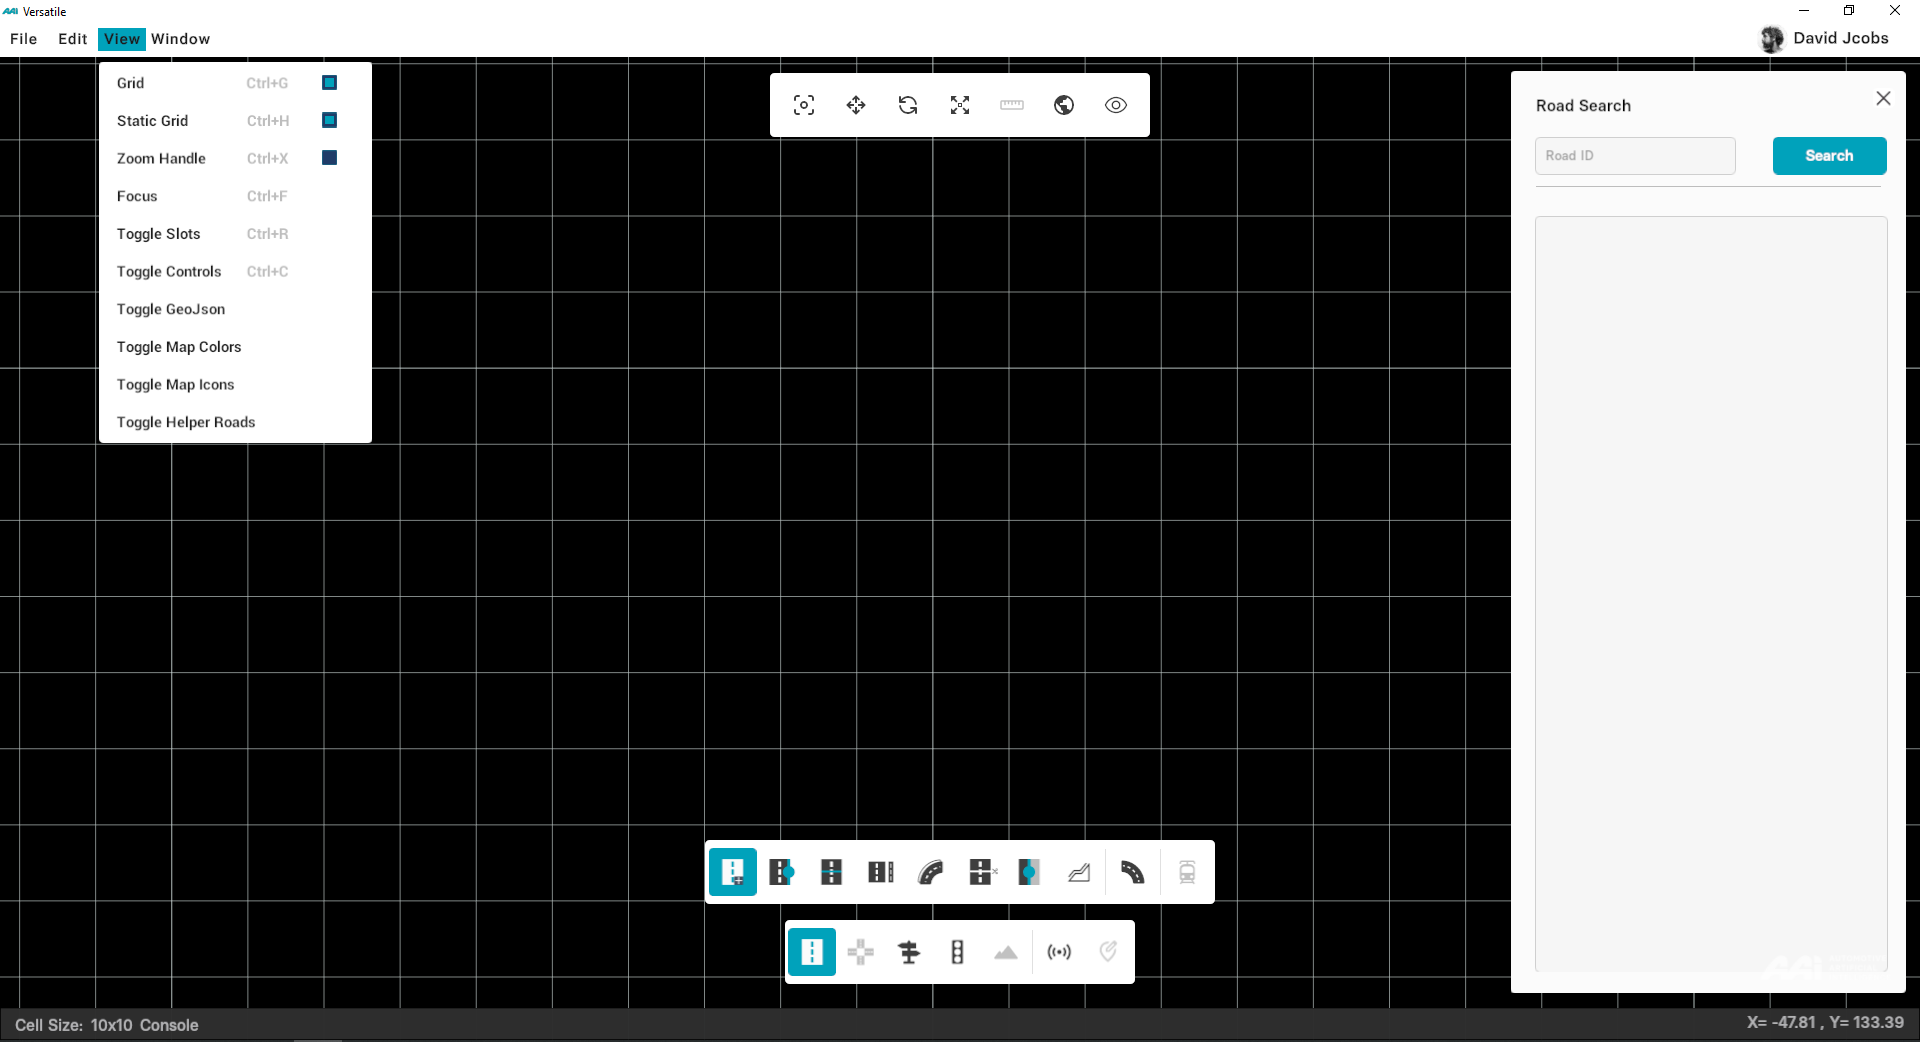
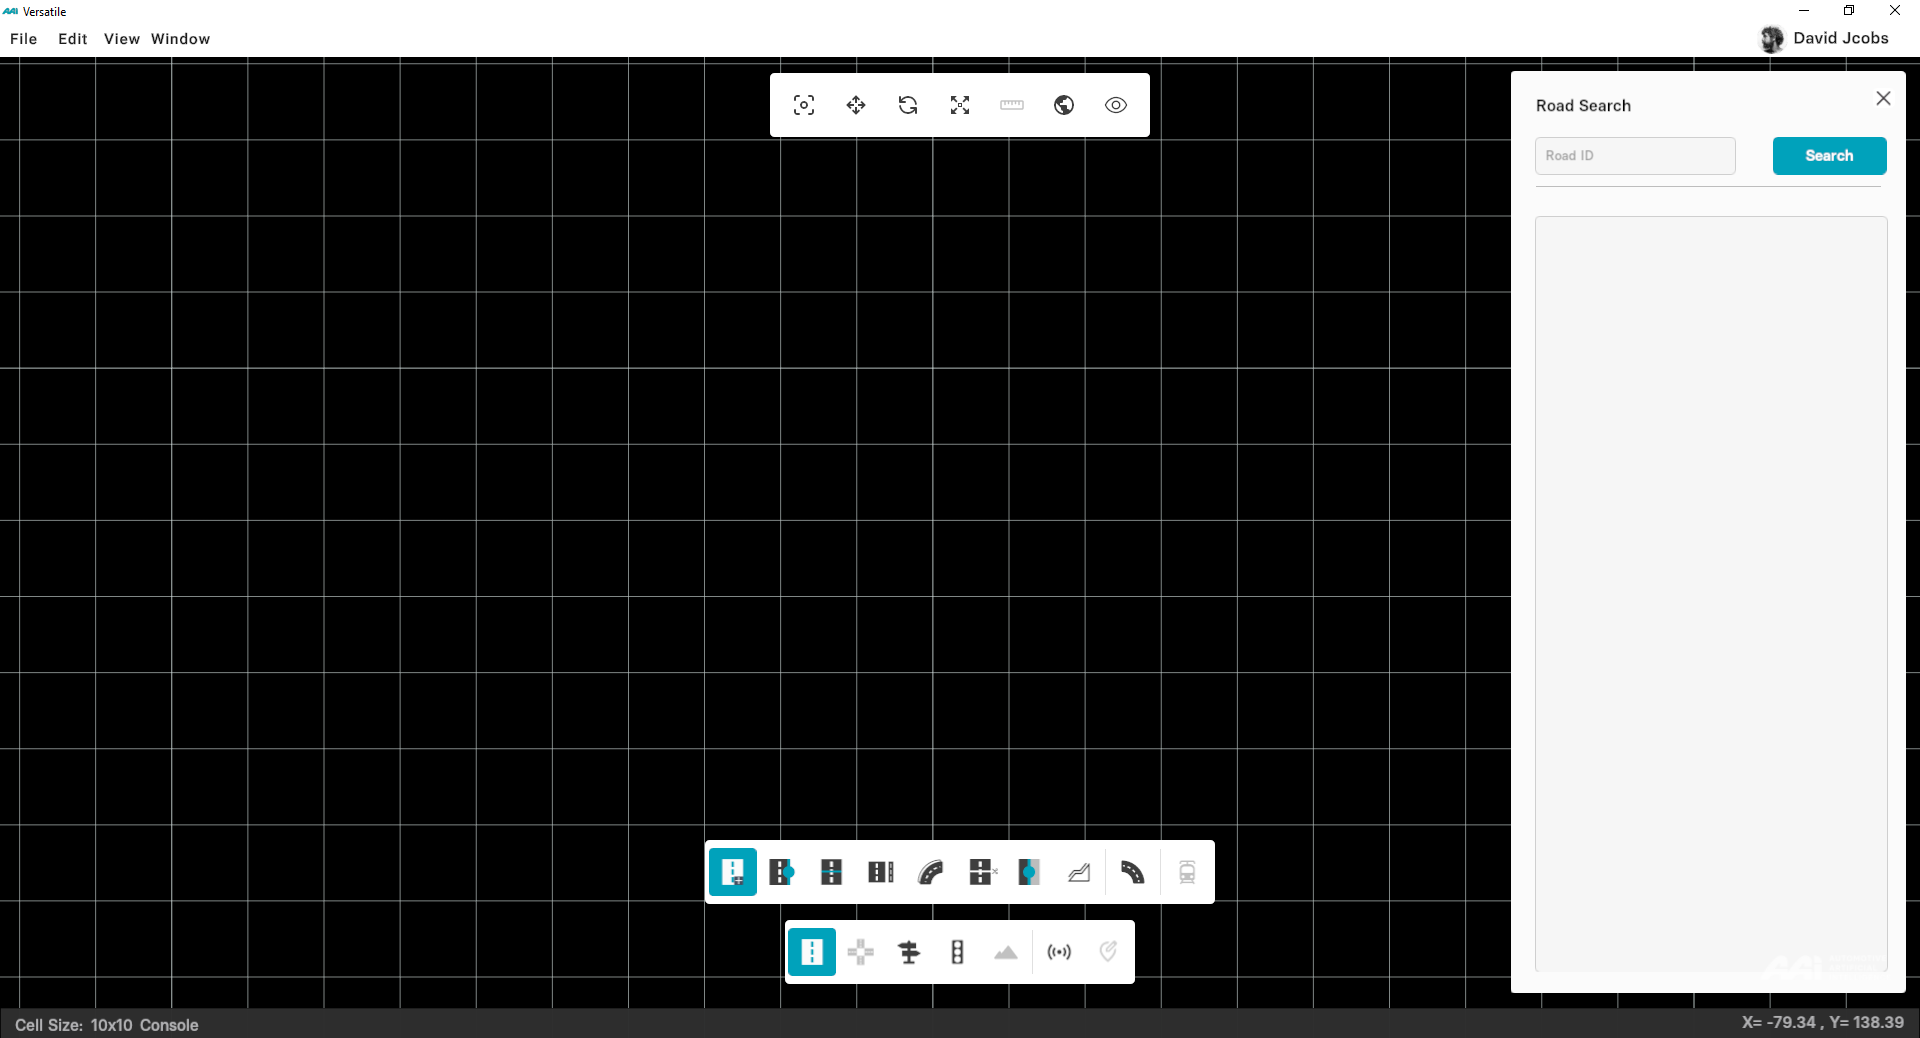
Toggle Map Icons
Allows the user to hide the objects/signals inside of a specific road without the need of moving them (hides the sign).
![]()
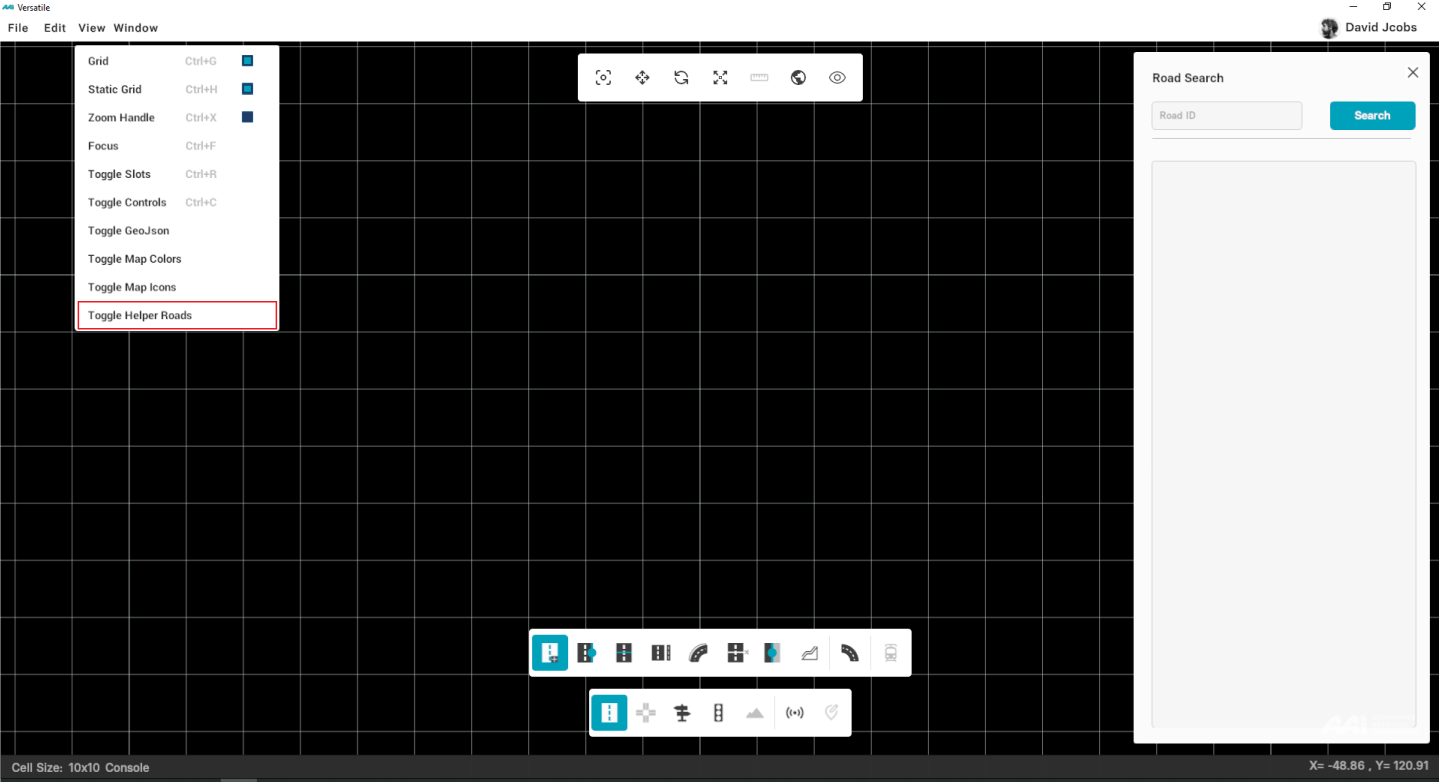
Toggle Helper Roads
Allows the user to toggle the visibility of helper roads.
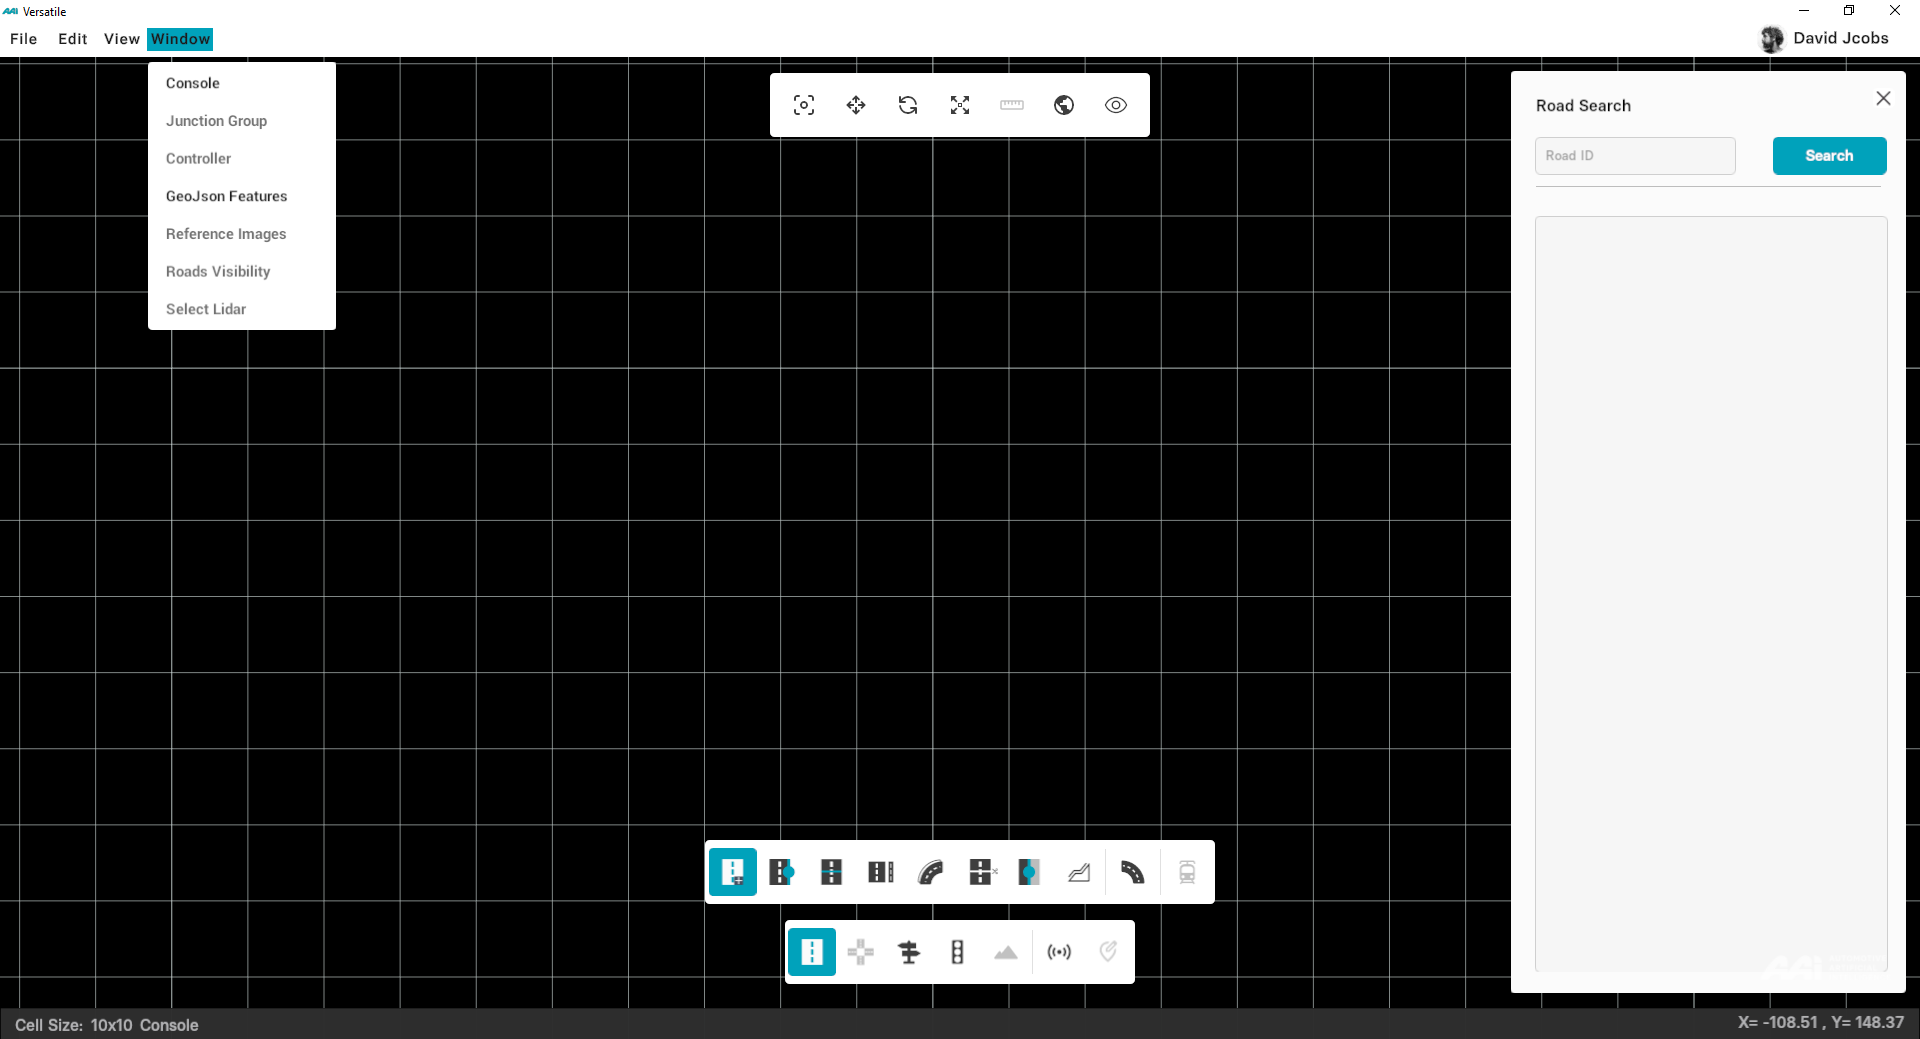
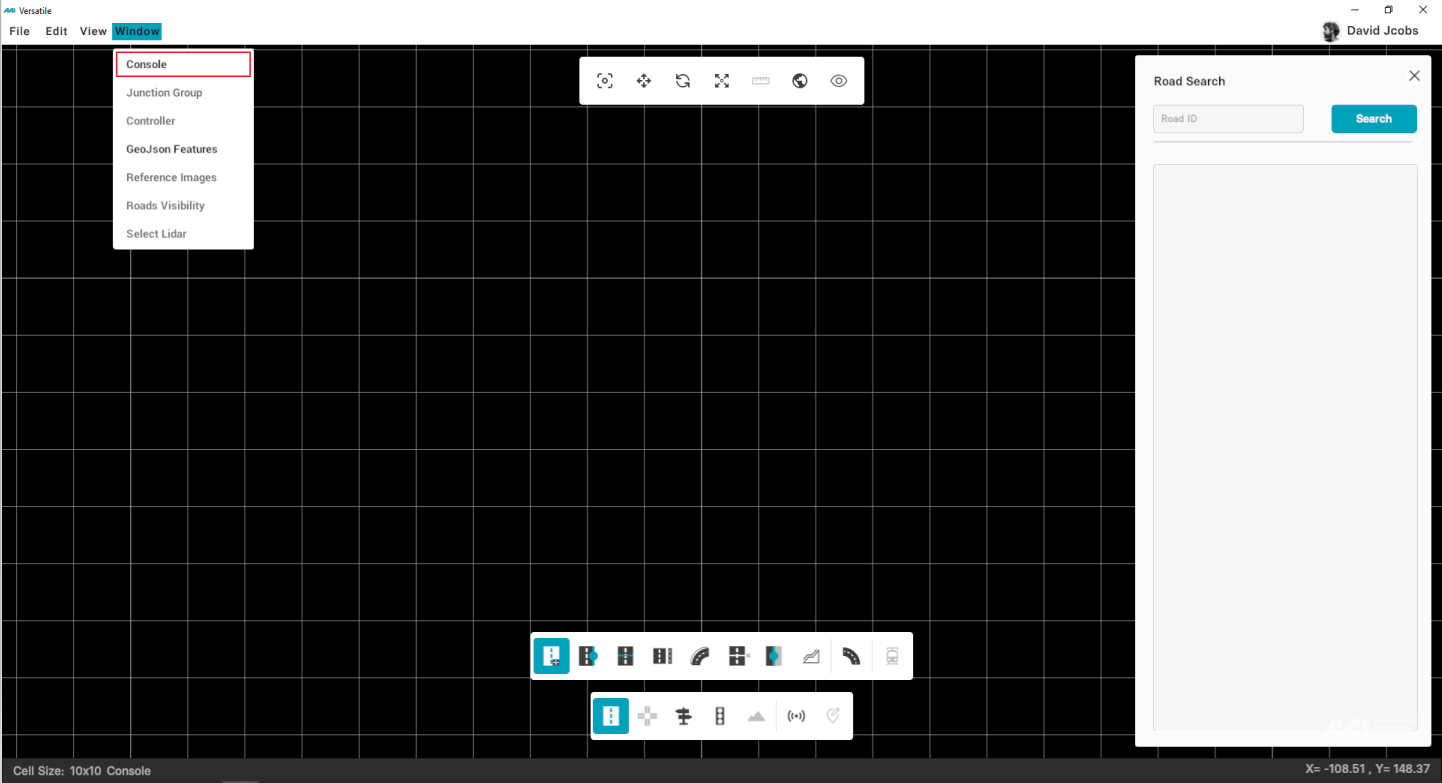
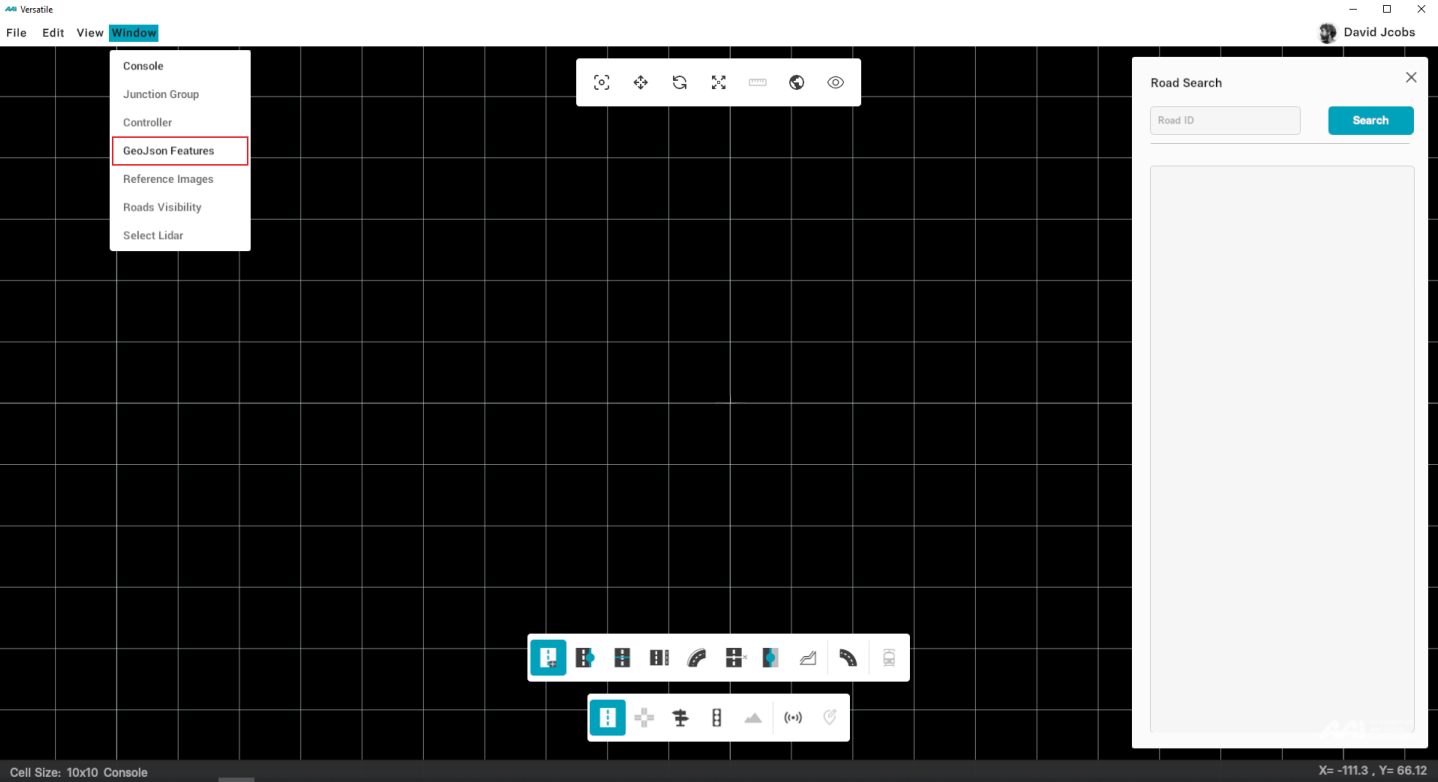
Window
A horizontal bar located at the top-left of the menu bar, provides you a variety of functions. Kindly note the listed.
- Console
- Junction Group
- Controller
- GeoJson Features
- Reference Images
- Roads Visibility
- Select Lidar
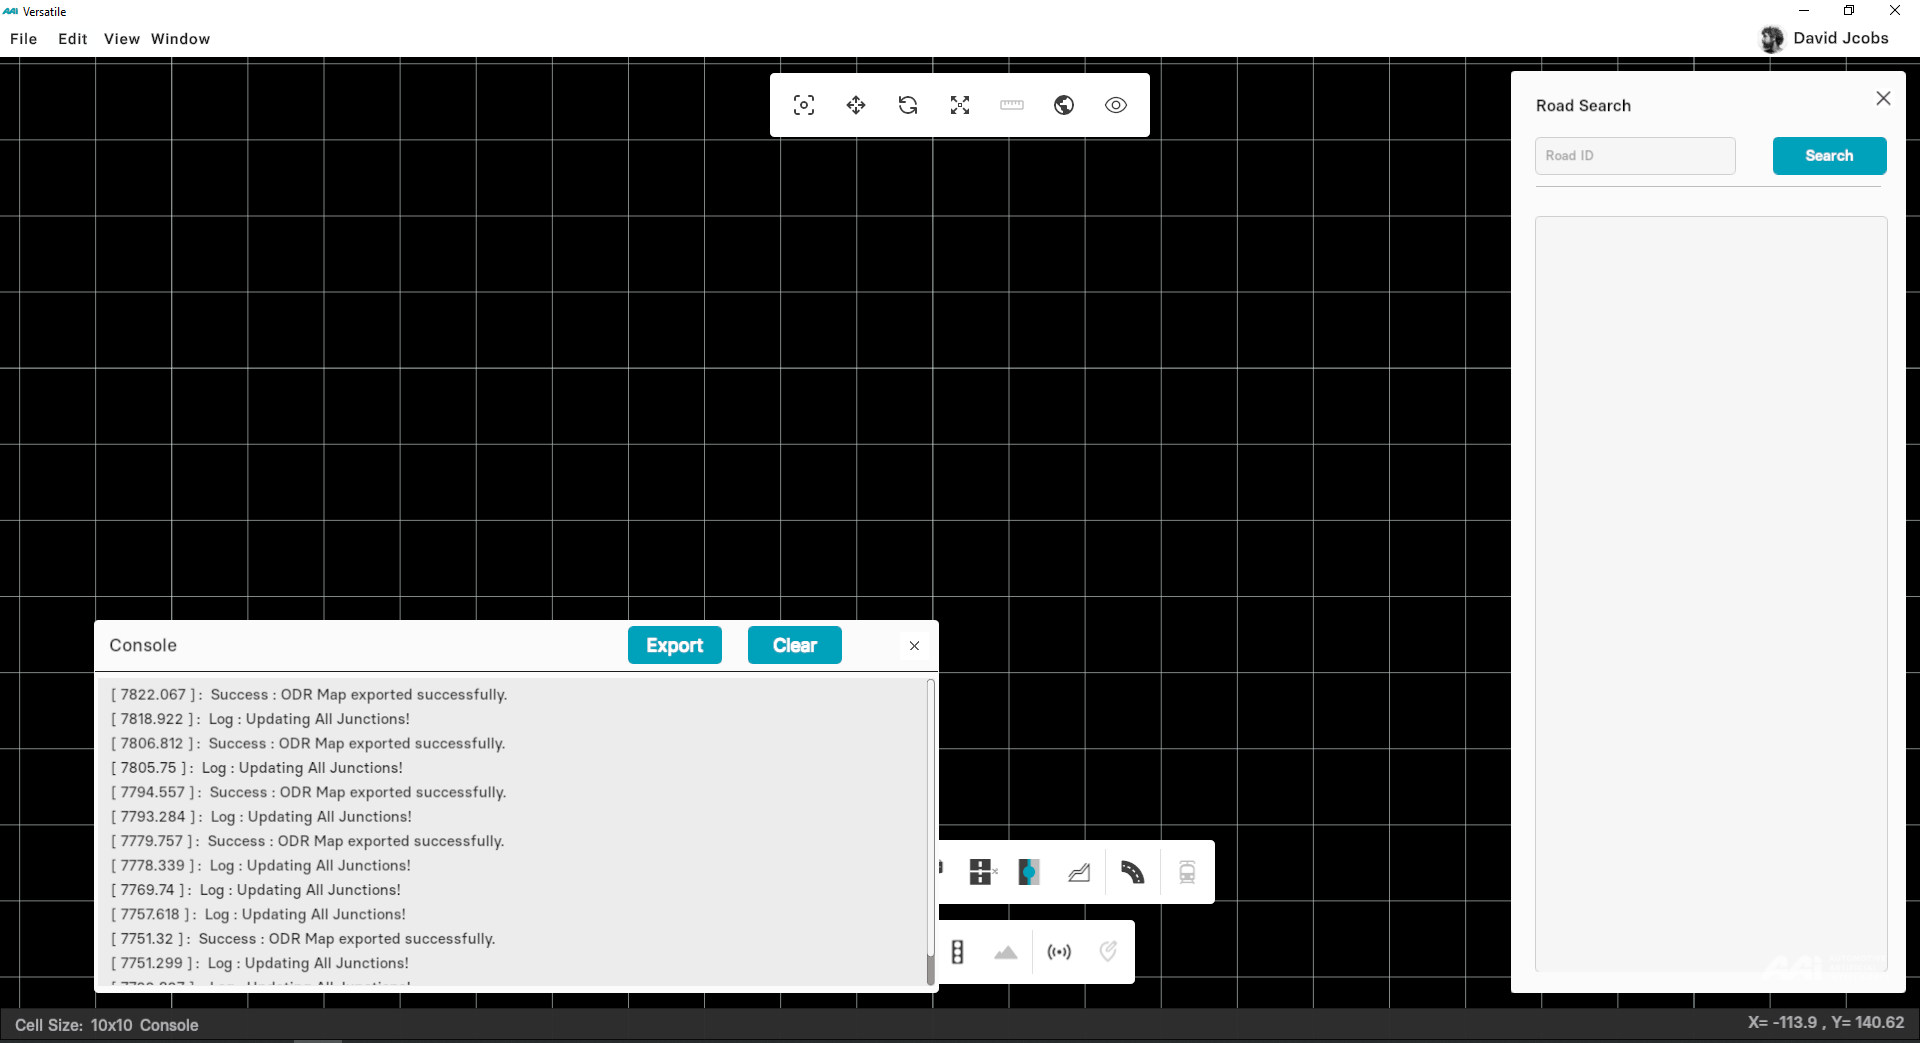
Console
The purpose of Console is to display errors and warnings while using any tool or performing any operations in RepliMap. Furthermore, it shows alerts if something goes wrong during loading or saving a map in RepliMap.
1. Select "Console" from drop-down menu that appears by clicking on "Window" in menu bar.
2. A new window pops up at the bottom-left side of your screen, displaying all the errors occured while creating a map.
Script
Feature is currently unavailable in the latest RepliMap version.
Provides the user with the ability to execute custom scripts. A dedicated window opens, displaying a detailed description of the script, configuration options, and a console for viewing script details before execution. Additionally, clear instructions are included to guide the user through the script execution process.
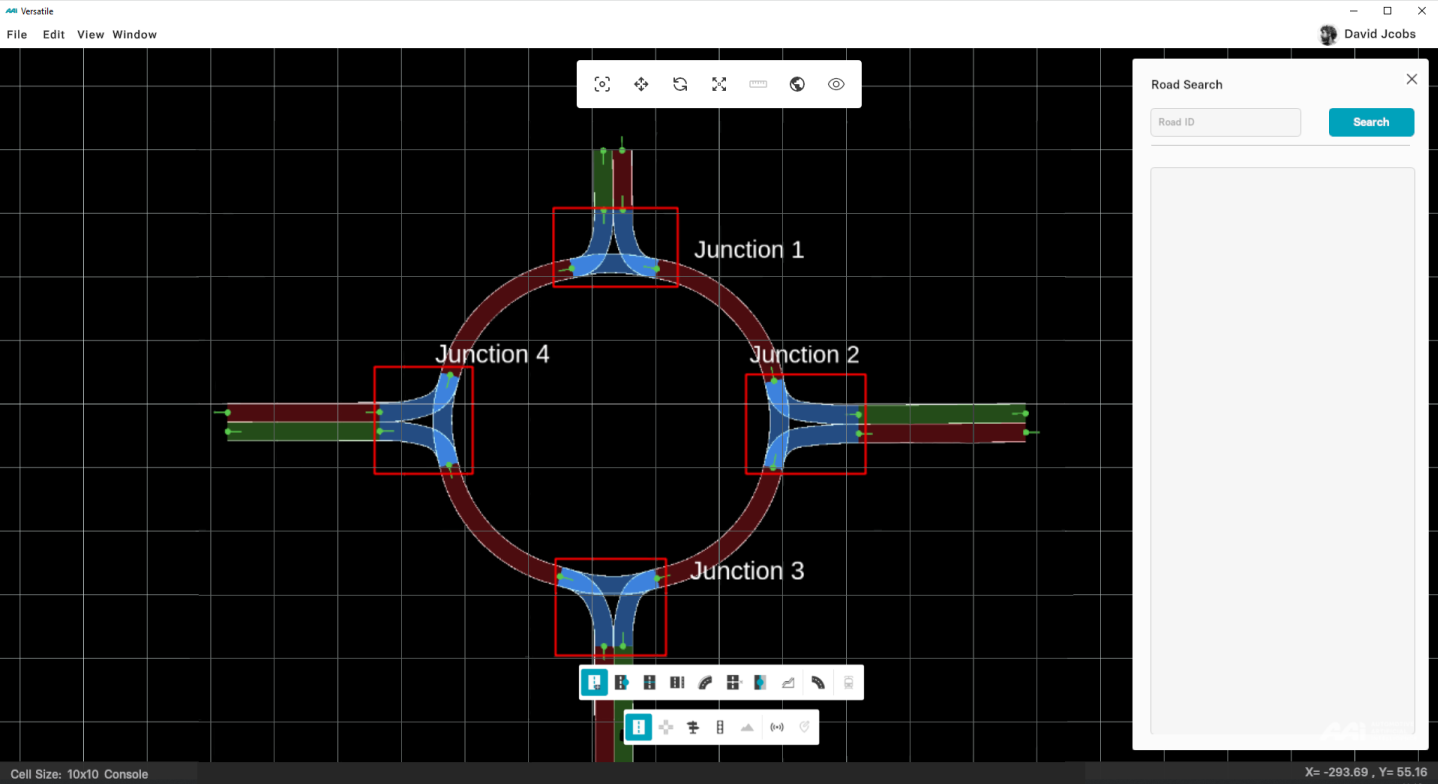
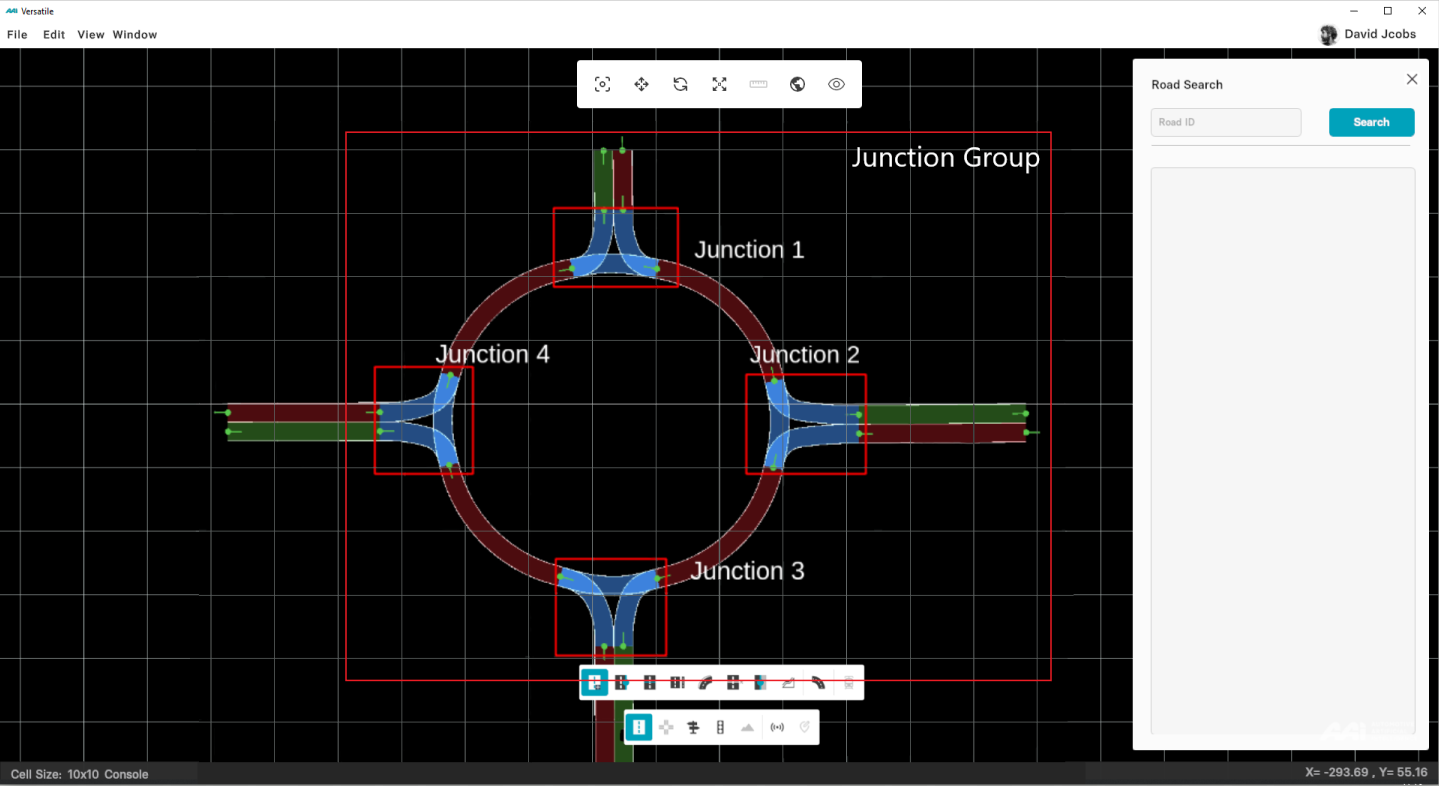
Junction Group
This feature lets you combine two or more existing junctions together to serve as a single junction group (e.g. roundabouts) for traffic simulation purposes.
Controller
Information is currently unavailable in the latest RepliMap version.
GeoJson Features
This function toggles the GeoJson customization display, allowing users to adjust the user interface according to their preferences.
Reference Images
Enables users to insert a desired image of their choice into the RepliMap, offering versatility. Users can select the image, resize it, and position it anywhere on the map as needed.
Road Visibility
Allows the user to change the appearance of a specific road without altering the road (not deleting nor modifying). It shows all the hidden roads in the map with their corresponding ID. First toggle shows/hides the entire road, second toggle shows/hides the lanes.
Three State Toggle:
• Polygon: Allows the user to select specific roads as per specification.
• Middle: Neutral/normal visibility.
• Junction: Allows the user to select the roads based on a junction group.
Select Lidar
Subject to further description for more information.
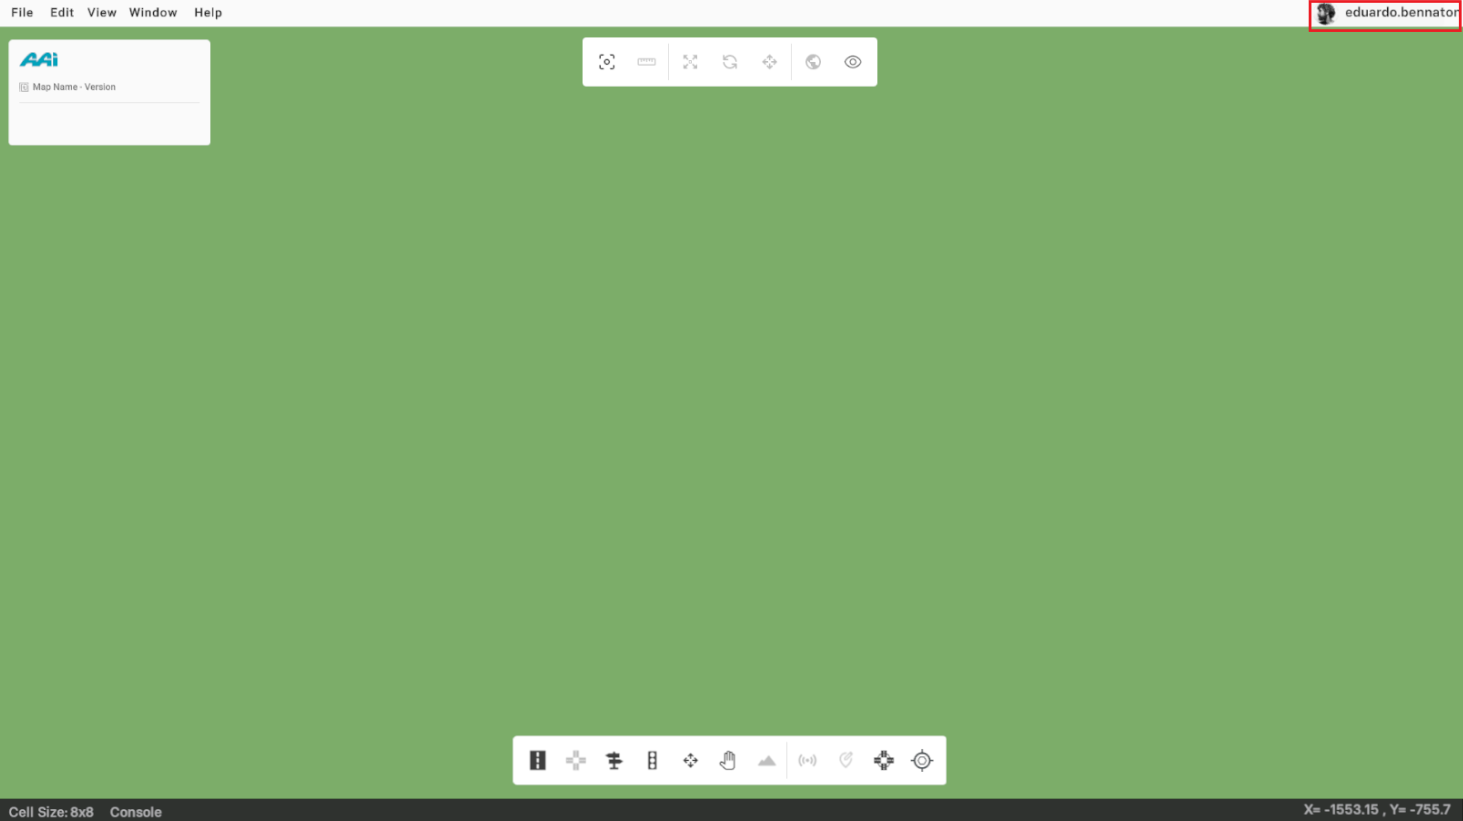
User
Displays the user's profile picture and account name in the top-right corner of the application window. This element serves both as a means of identification and as an access point for additional functionality within the software.
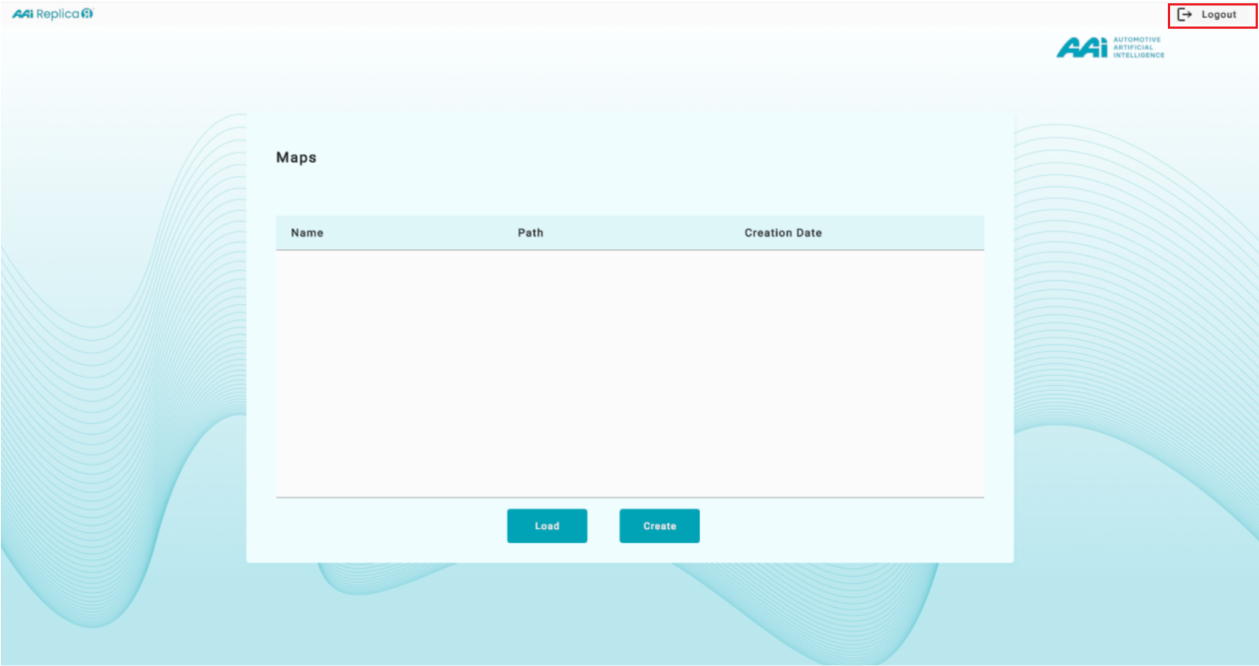
Home
Allows the user to return to the home page, where the cloud map information is stored within the software platform. If the currently loaded map has unsaved changes, attempting to navigate away will trigger a warning about unsaved progress.
1. Select the "Home" option under the user profile's selection panel.
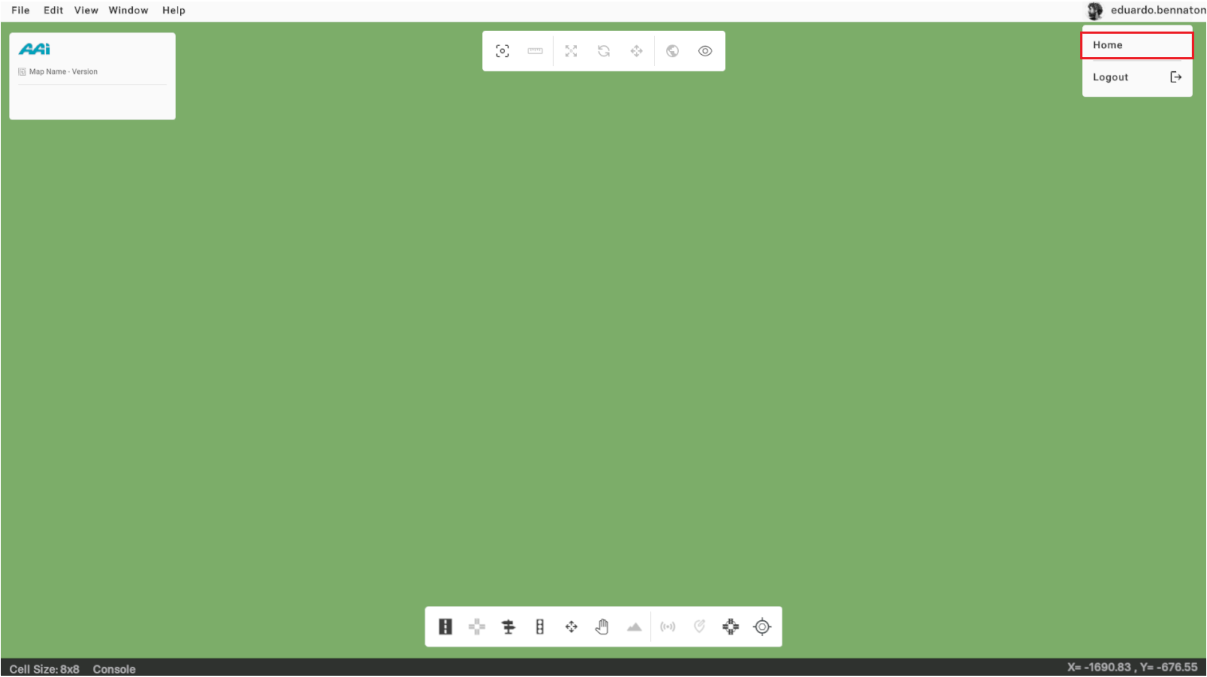
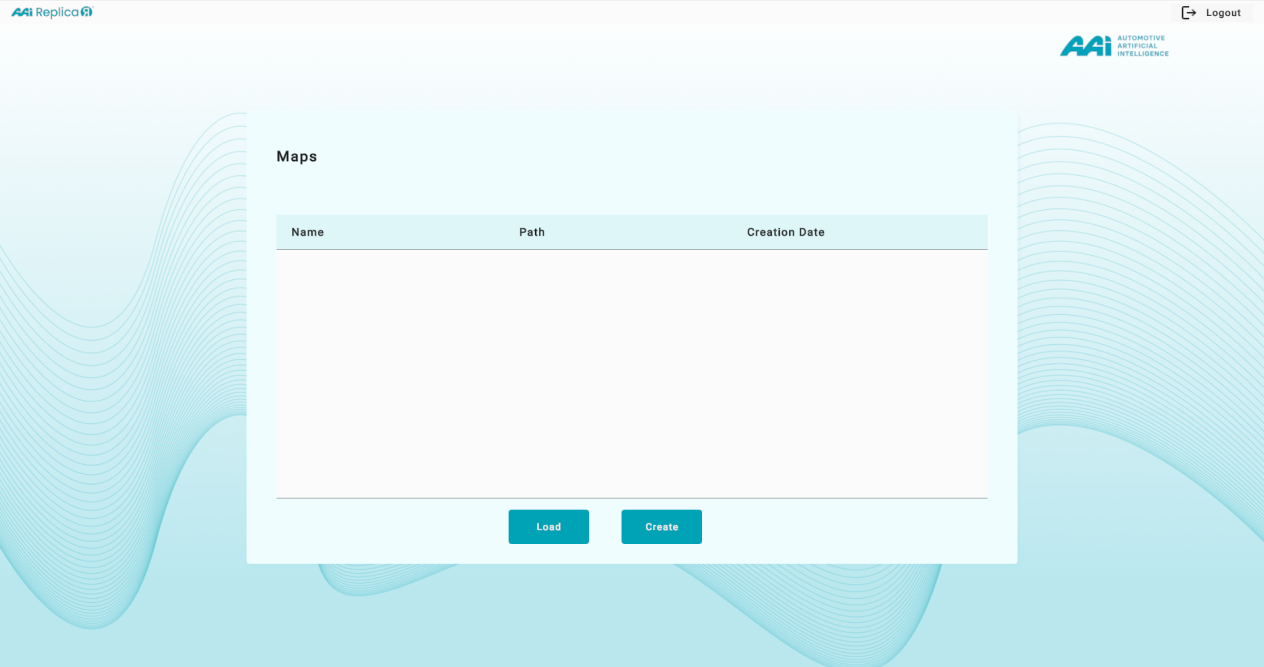
2. Redirects the user to the home page, where their cloud-saved maps are located. From this page, the user can load an existing map or create a new one, depending on their intended action.
Logout
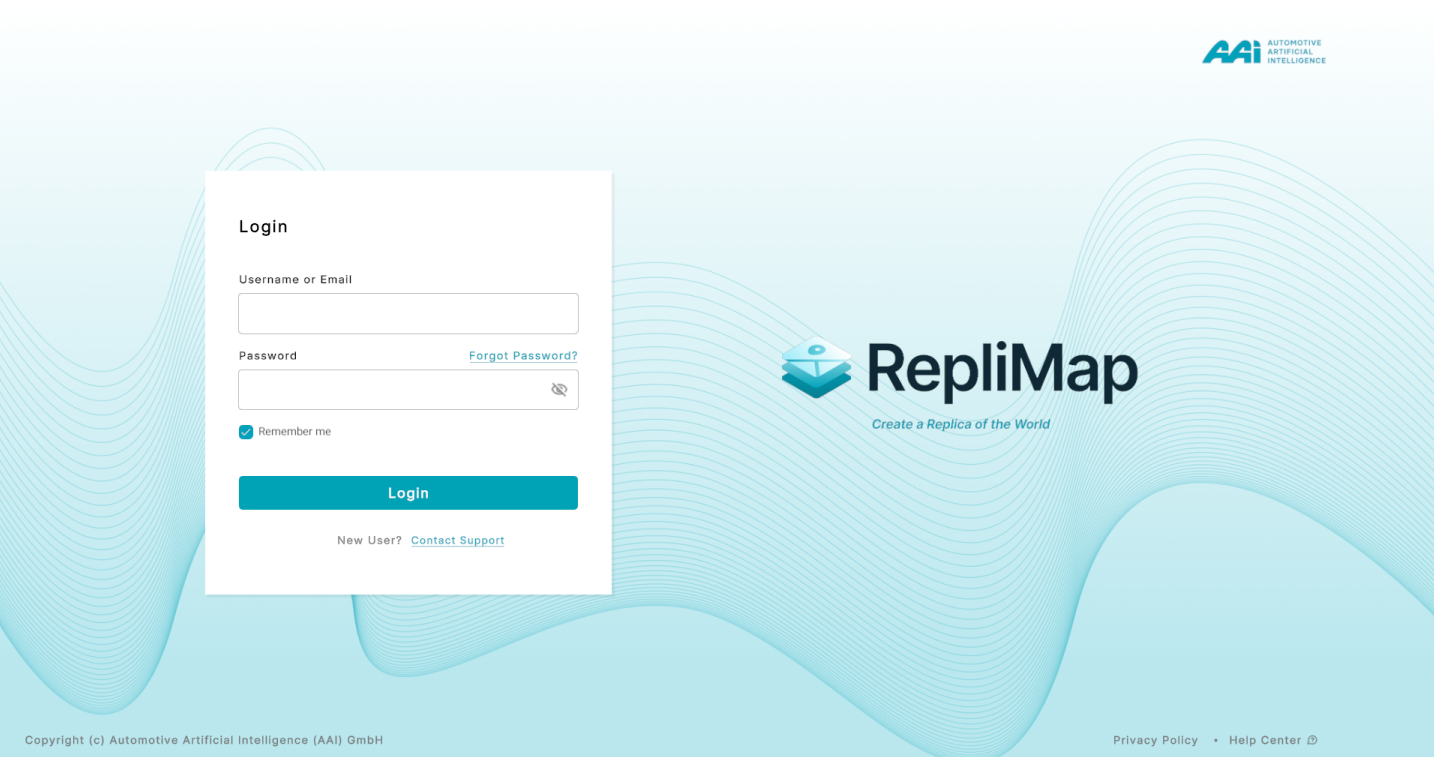
Signs the user out of the mapping software platform, ending the current session and returning to the login screen.
1. Select the "Logout" option under the user profile's selection panel.
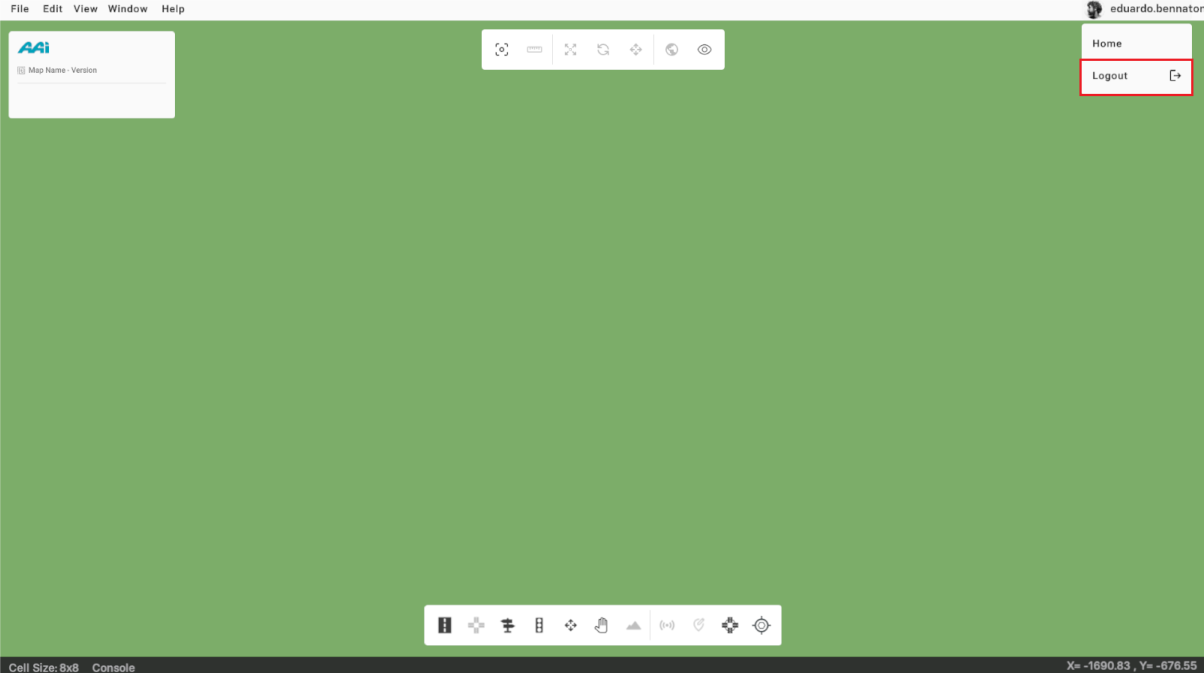
2. This action will redirect the user to the login screen. Alternatively, the user can log out from the "Home" page within the platform.